Reservoir Storage Summary for Climate Divisions on 2026-07-30
Percent Full
| Today | Yesterday | 2 days ago | 1 week ago | 1 month ago | 3 months ago | 6 months ago | 1 year ago | |
|---|---|---|---|---|---|---|---|---|
| 2026-07-30 | 2026-07-29 | 2026-07-28 | 2026-07-23 | 2026-06-30 | 2026-04-30 | 2026-01-30 | 2025-07-30 | |
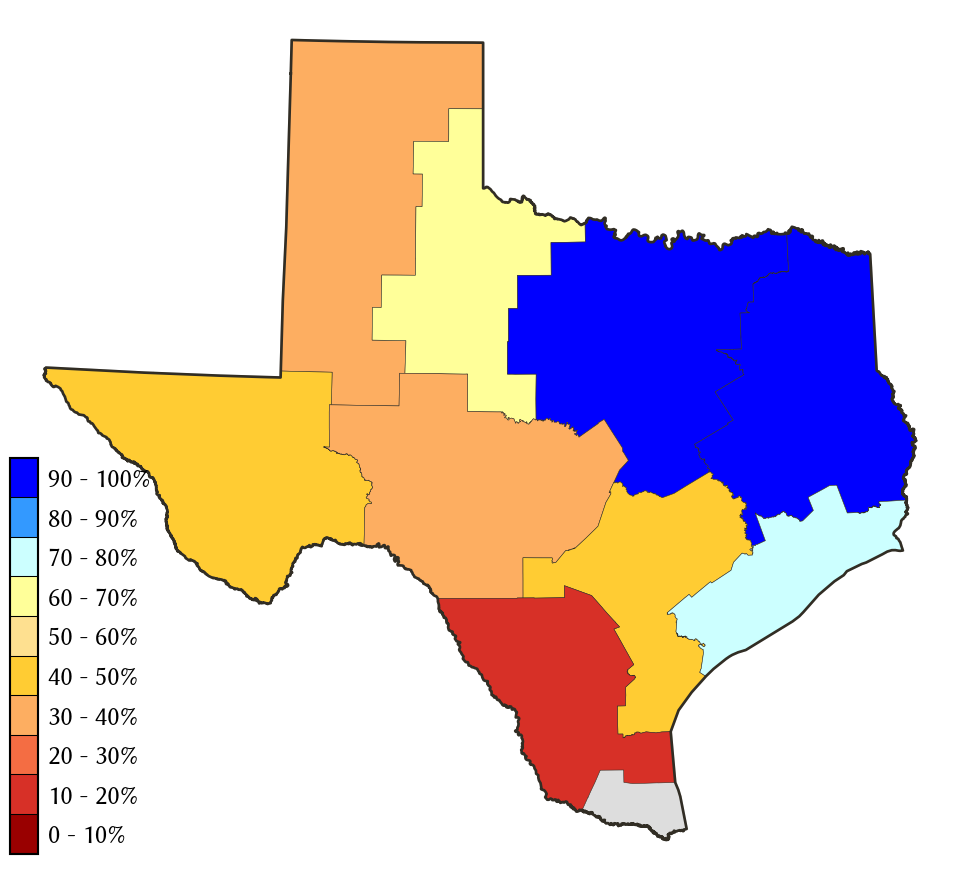
| East Texas | 87.5 | 87.5 | 87.7 | 88.3 | 89.1 | 87.1 | 84.2 | 92.0 |
| Edwards Plateau | 48.6 | 48.3 | 48.3 | 48.0 | 45.2 | 45.2 | 46.0 | 49.1 |
| High Plains | 35.7 | 35.8 | 35.8 | 36.0 | 36.8 | 37.3 | 38.9 | 40.1 |
| Low Rolling Plains | 58.2 | 58.2 | 58.4 | 58.9 | 61.2 | 62.4 | 64.5 | 72.0 |
| North Central | 94.0 | 94.1 | 94.2 | 94.8 | 95.5 | 94.1 | 90.6 | 97.3 |
| South | 27.1 | 27.4 | 27.4 | 23.9 | 21.9 | 16.3 | 16.1 | 15.9 |
| South Central | 90.3 | 90.3 | 90.3 | 90.3 | 72.0 | 62.2 | 65.5 | 76.0 |
| Trans Pecos | 48.2 | 48.3 | 48.3 | 48.5 | 49.8 | 53.7 | 55.1 | 50.3 |
| Upper Coast | 97.8 | 97.8 | 97.9 | 98.9 | 99.6 | 77.5 | 78.3 | 97.9 |
*
Percent Full is based on Conservation Storage and Conservation Capacity.
Recent Conditions
| Percent Full |
Reservoir Storage (acre-ft) |
Conservation Storage (acre-ft) |
Conservation Capacity (acre-ft) |
|
|---|---|---|---|---|
| East Texas | 87.5 | 11,093,391 | 8,672,925 | 9,915,173 |
| Edwards Plateau | 48.6 | 2,193,813 | 2,072,769 | 4,261,647 |
| High Plains | 35.7 | 266,880 | 228,466 | 639,362 |
| Low Rolling Plains | 58.2 | 528,358 | 525,814 | 903,870 |
| North Central | 94.0 | 11,815,395 | 10,329,286 | 10,983,823 |
| South | 27.1 | 824,586 | 671,756 | 2,481,249 |
| South Central | 90.3 | 1,792,718 | 1,749,846 | 1,936,953 |
| Trans Pecos | 48.2 | 70,007 | 70,007 | 145,165 |
| Upper Coast | 97.8 | 293,844 | 284,830 | 291,293 |
**
The Lower Valley climate division has no contributing Reservoirs present.