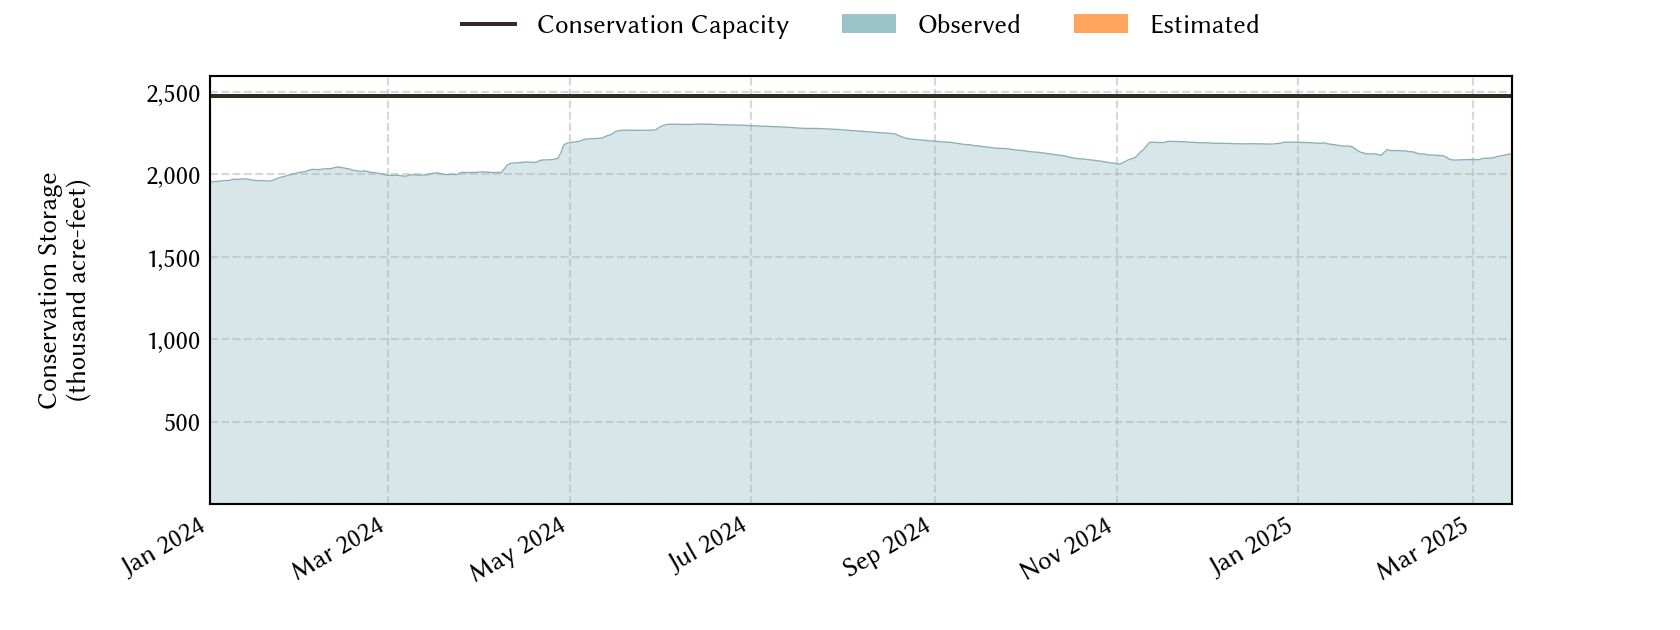
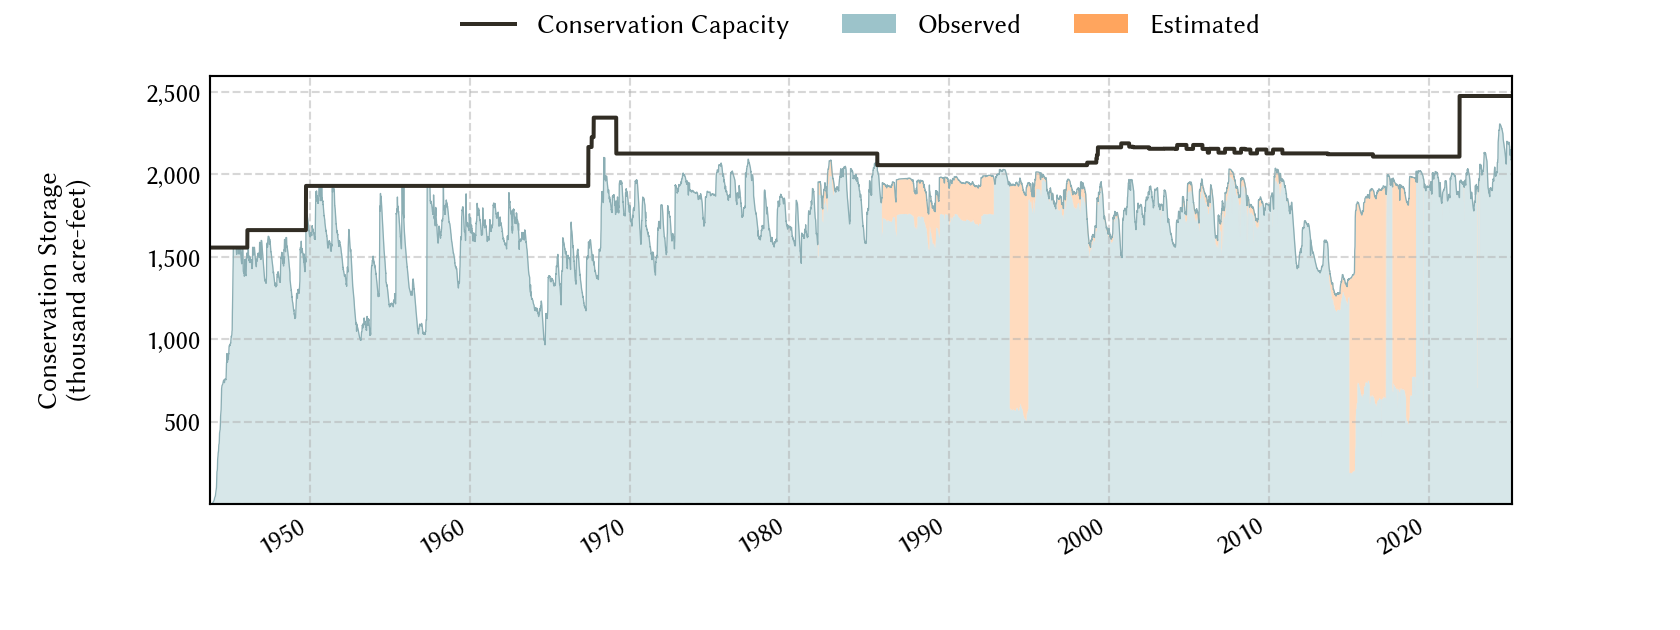
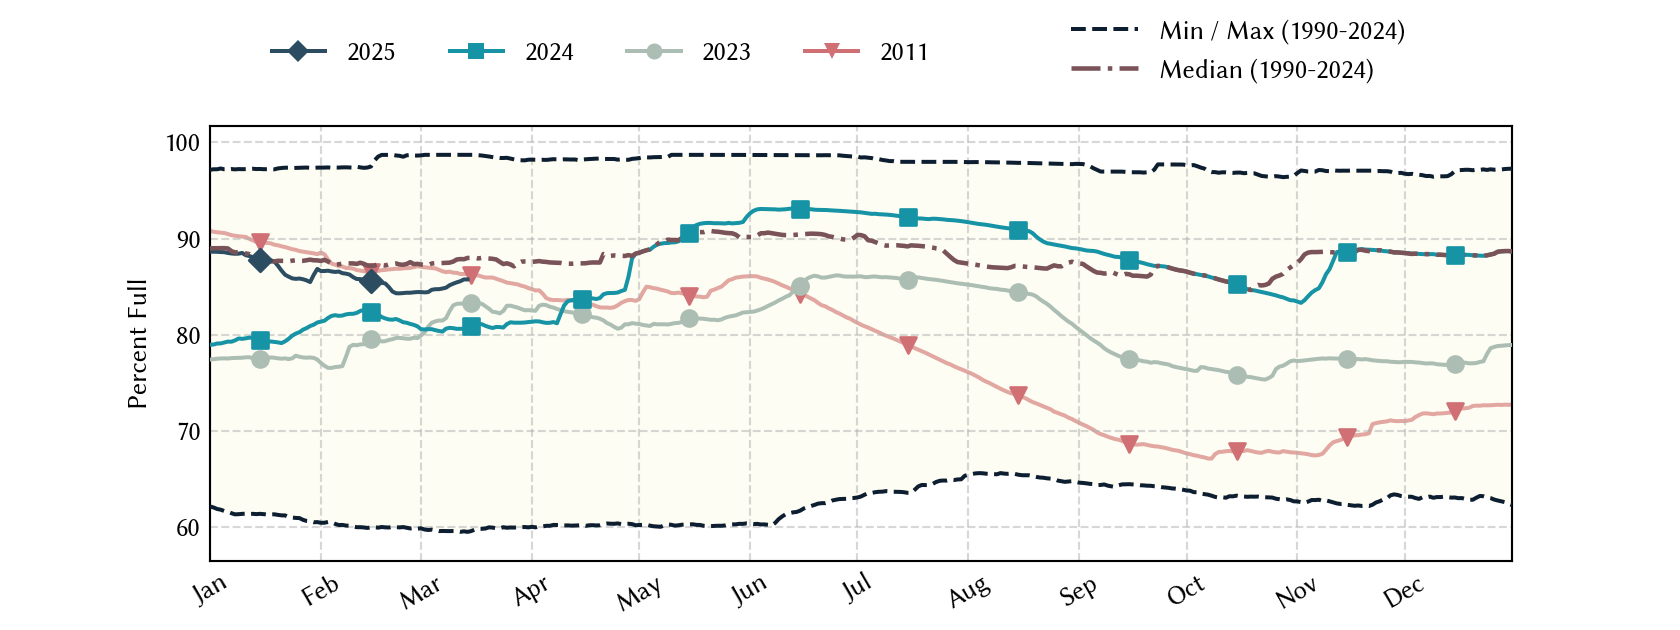
Red River Basin Reservoirs: Monitored Water Supply Reservoirs are 91.3% full on 2026-07-30
Historical Data
| Date | Percent Full |
Reservoir Storage (acre-ft) |
Conservation Storage (acre-ft) |
Conservation Capacity (acre-ft) |
|
|---|---|---|---|---|---|
| Today | 2026-07-30 | 91.3 | 3,601,521 | 2,259,435 | 2,474,646 |
| Yesterday | 2026-07-29 | 91.3 | 3,605,178 | 2,260,475 | 2,474,646 |
| 2 days ago | 2026-07-28 | 91.4 | 3,611,009 | 2,262,039 | 2,474,646 |
| 1 week ago | 2026-07-23 | 91.7 | 3,635,275 | 2,269,690 | 2,474,646 |
| 1 month ago | 2026-06-30 | 93.5 | 3,744,861 | 2,313,126 | 2,474,646 |
| 3 months ago | 2026-04-30 | 91.4 | 3,525,993 | 2,261,671 | 2,474,646 |
| 6 months ago | 2026-01-30 | 89.6 | 3,434,630 | 2,216,962 | 2,474,646 |
| 1 year ago | 2025-07-30 | 95.3 | 3,750,406 | 2,358,026 | 2,474,646 |
*
Percent Full is based on Conservation Storage and Conservation Capacity and doesn't account for storage in flood pool.
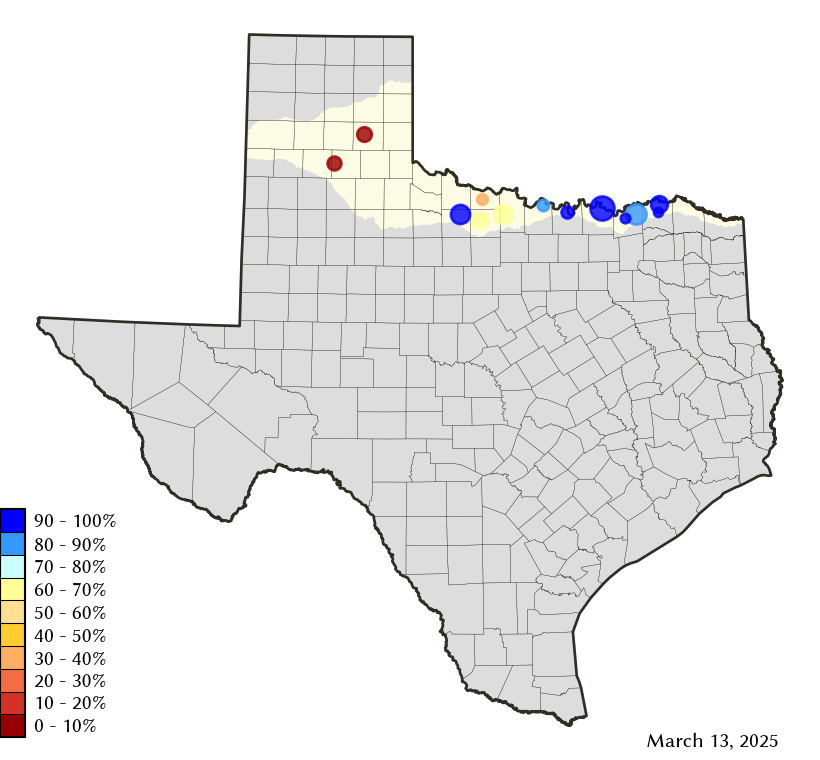
Area Map
Reservoir Storage
| Reservoir | Type | Percent Full |
Water Level (ft) |
Height Above Conservation Pool (ft) |
Reservoir Storage (acre-ft) |
Conservation Storage (acre-ft) |
Conservation Capacity (acre-ft) |
Surface Area (acres) |
|---|---|---|---|---|---|---|---|---|
| Arrowhead |

|
78.6 | 922.37 | -3.63 | 181,101 | 181,101 | 230,359 | 12,634 |
| Bois d'Arc |
|
98.4 | 533.64 | -0.36 | 361,823 | 361,823 | 367,609 | 16,370 |
| Bonham |
|
93.3 | 564.29 | -0.71 | 10,303 | 10,291 | 11,027 | 1,019 |
| Crook |
|
97.1 | 475.74 | -0.26 | 8,939 | 8,924 | 9,195 | 1,041 |
| Greenbelt |
|
5.7 | 2,609.13 | -54.87 | 3,840 | 3,408 | 59,968 | 308 |
| Hubert H Moss |
|
96.2 | 714.15 | -0.85 | 23,245 | 23,148 | 24,058 | 1,059 |
| Kemp |

|
82.8 | 1,141.68 | -2.32 | 203,278 | 203,152 | 245,307 | 11,423 |
| Kickapoo |
|
86.2 | 1,042.88 | -2.12 | 74,424 | 74,424 | 86,345 | 5,382 |
| Mackenzie |
|
11.6 | 3,019.88 | -80.12 | 5,370 | 5,370 | 46,450 | 244 |
| Nocona |
|
79.8 | 824.12 | -3.38 | 17,424 | 17,120 | 21,444 | 1,215 |
| North Fork Buffalo Creek |
|
85.6 | 1,046.61 | -1.39 | 13,190 | 13,190 | 15,400 | 1,363 |
| Pat Mayse |
|
100.0 | 451.20 | 0.20 | 118,973 | 113,683 | 113,683 | - n.a. - |
| Texoma 1 |
|
100.0 | 618.19 | 1.19 | 2,579,611 | 1,243,801 | 1,243,801 | 79,326 |
footnotes
1
Lake Texoma straddles the border of Texas and Oklahoma, Texas has rights to 50% of Lake Texoma's total conservation capacity. Percent full, conservation storage and conservation capacity are based on the Texas share.