South-Central-Texas Planning Region Reservoirs: Monitored Water Supply Reservoirs are 72.0% full on 2026-07-29
Historical Data
| Date | Percent Full |
Reservoir Storage (acre-ft) |
Conservation Storage (acre-ft) |
Conservation Capacity (acre-ft) |
|
|---|---|---|---|---|---|
| Today | 2026-07-29 | 72.0 | 486,996 | 478,463 | 664,644 |
| Yesterday | 2026-07-28 | 72.0 | 486,792 | 478,677 | 664,644 |
| 2 days ago | 2026-07-27 | 72.0 | 486,046 | 478,515 | 664,644 |
| 1 week ago | 2026-07-22 | 71.6 | 478,198 | 475,899 | 664,644 |
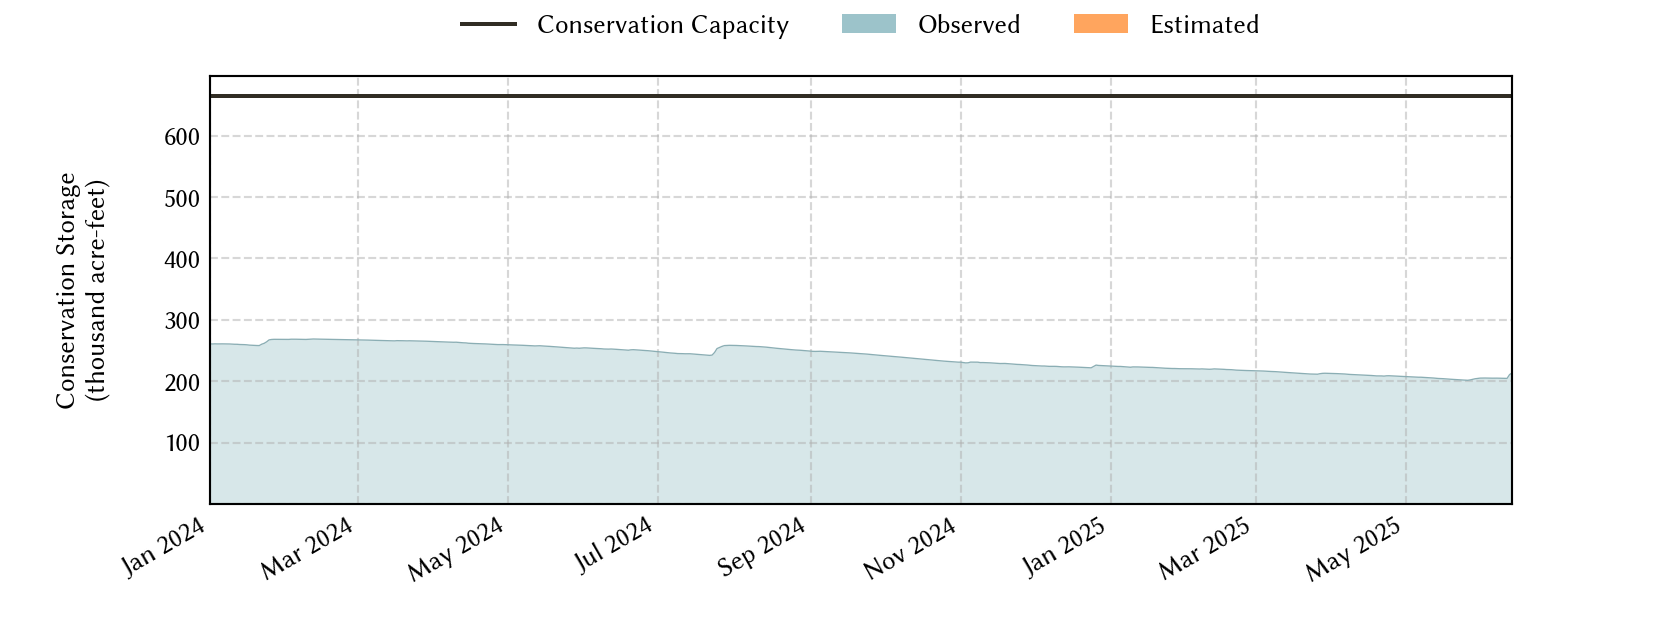
| 1 month ago | 2026-06-29 | 42.4 | 281,933 | 281,862 | 664,644 |
| 3 months ago | 2026-04-29 | 38.5 | 256,071 | 256,000 | 664,644 |
| 6 months ago | 2026-01-29 | 40.0 | 265,822 | 265,751 | 664,644 |
| 1 year ago | 2025-07-29 | 46.0 | 305,769 | 305,698 | 664,644 |
*
Percent Full is based on Conservation Storage and Conservation Capacity and doesn't account for storage in flood pool.
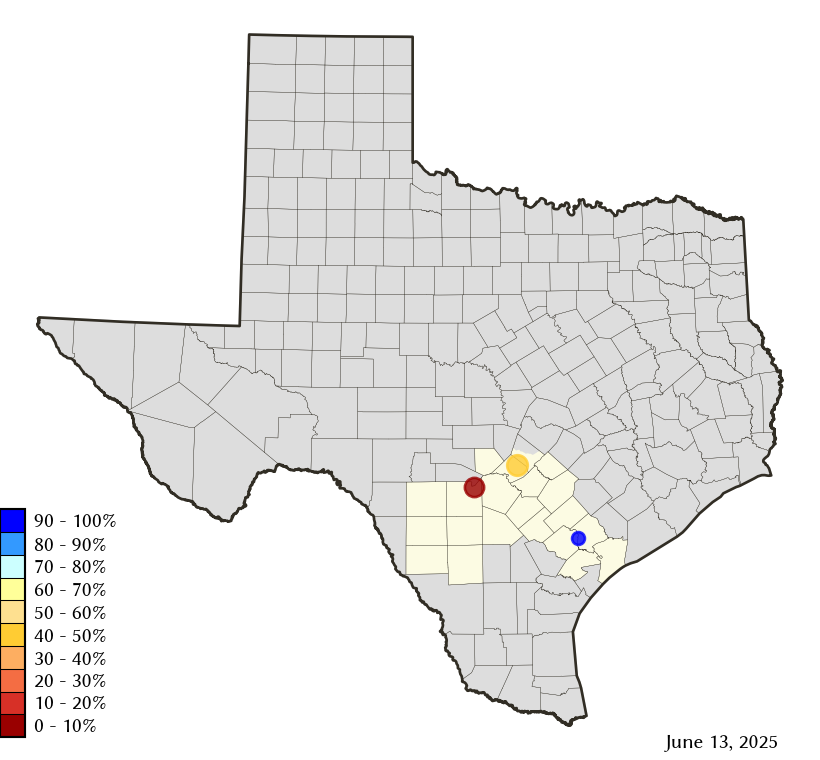
Area Map
Reservoir Storage
| Reservoir | Type | Percent Full |
Water Level (ft) |
Height Above Conservation Pool (ft) |
Reservoir Storage (acre-ft) |
Conservation Storage (acre-ft) |
Conservation Capacity (acre-ft) |
Surface Area (acres) |
|---|---|---|---|---|---|---|---|---|
| Canyon |

|
100.0 | 910.02 | 1.02 | 387,314 | 378,781 | 378,781 | - n.a. - |
| Coleto Creek |

|
81.0 | 95.51 | -2.49 | 25,127 | 25,127 | 31,040 | 2,301 |
| Medina |
|
29.3 | 1,021.26 | -42.94 | 74,555 | 74,555 | 254,823 | 2,494 |