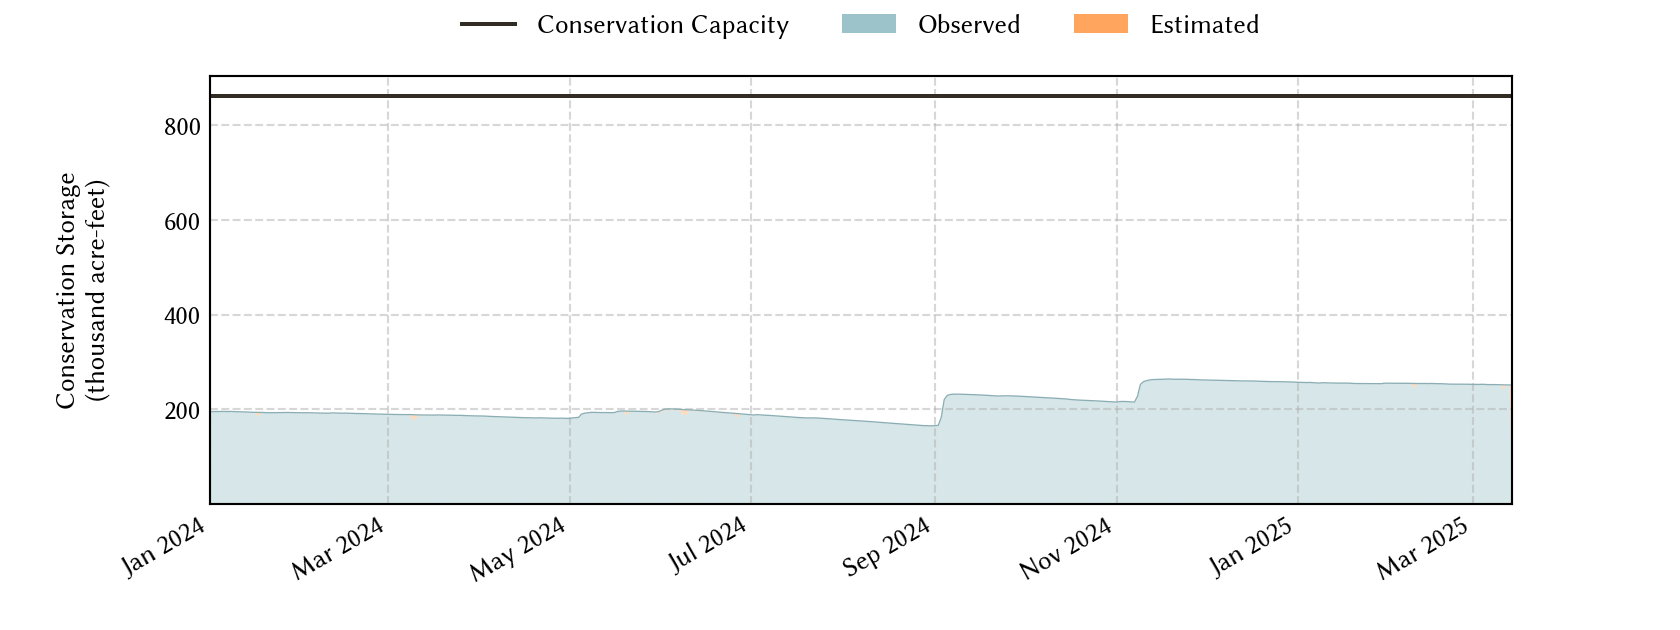
San Angelo Area Reservoirs: Monitored Water Supply Reservoirs are 34.0% full on 2026-07-30
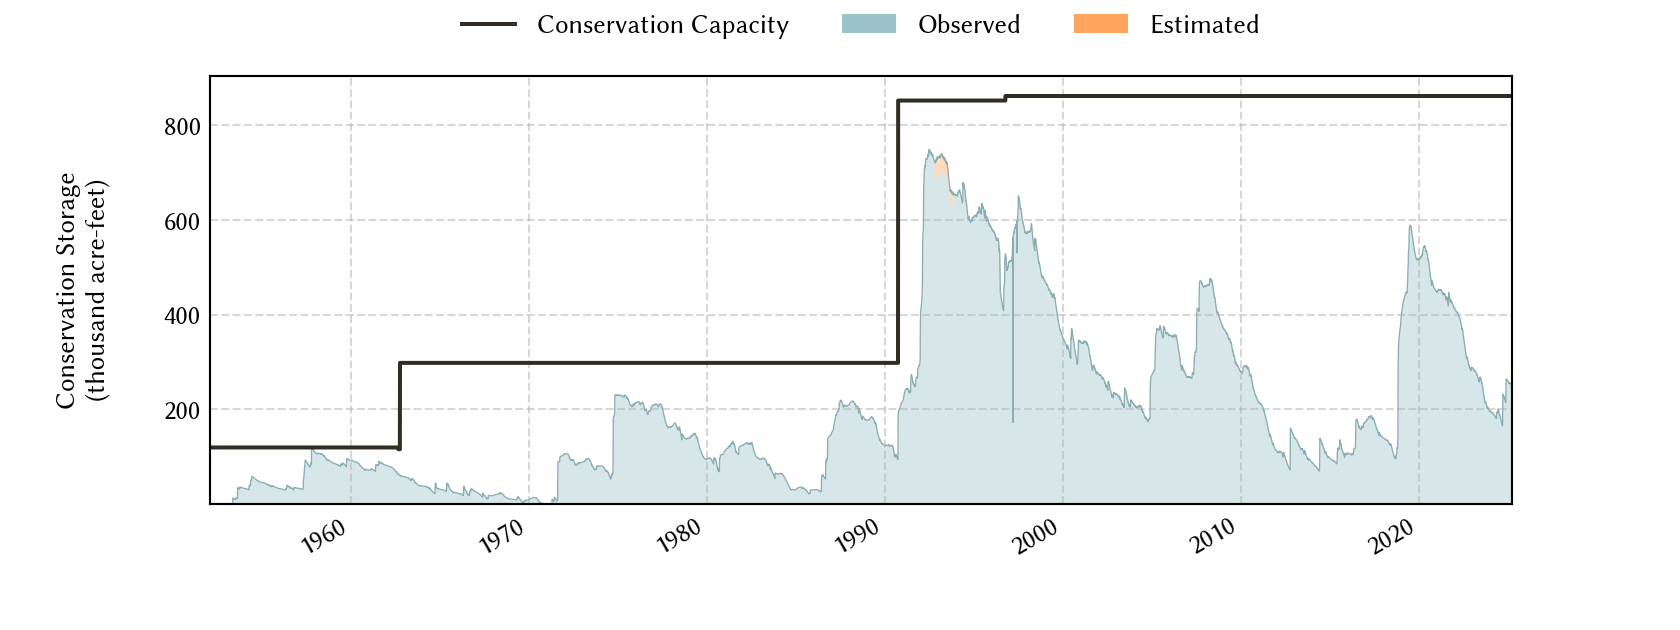
Historical Data
| Date | Percent Full |
Reservoir Storage (acre-ft) |
Conservation Storage (acre-ft) |
Conservation Capacity (acre-ft) |
|
|---|---|---|---|---|---|
| Today | 2026-07-30 | 34.0 | 297,456 | 293,213 | 862,151 |
| Yesterday | 2026-07-29 | 34.1 | 297,870 | 293,627 | 862,151 |
| 2 days ago | 2026-07-28 | 34.1 | 298,335 | 294,092 | 862,151 |
| 1 week ago | 2026-07-23 | 34.4 | 301,240 | 296,997 | 862,151 |
| 1 month ago | 2026-06-30 | 35.2 | 307,436 | 303,193 | 862,151 |
| 3 months ago | 2026-04-30 | 35.2 | 307,959 | 303,716 | 862,151 |
| 6 months ago | 2026-01-30 | 35.3 | 308,186 | 303,943 | 862,151 |
| 1 year ago | 2025-07-30 | 41.5 | 361,739 | 357,496 | 862,151 |
*
Percent Full is based on Conservation Storage and Conservation Capacity and doesn't account for storage in flood pool.
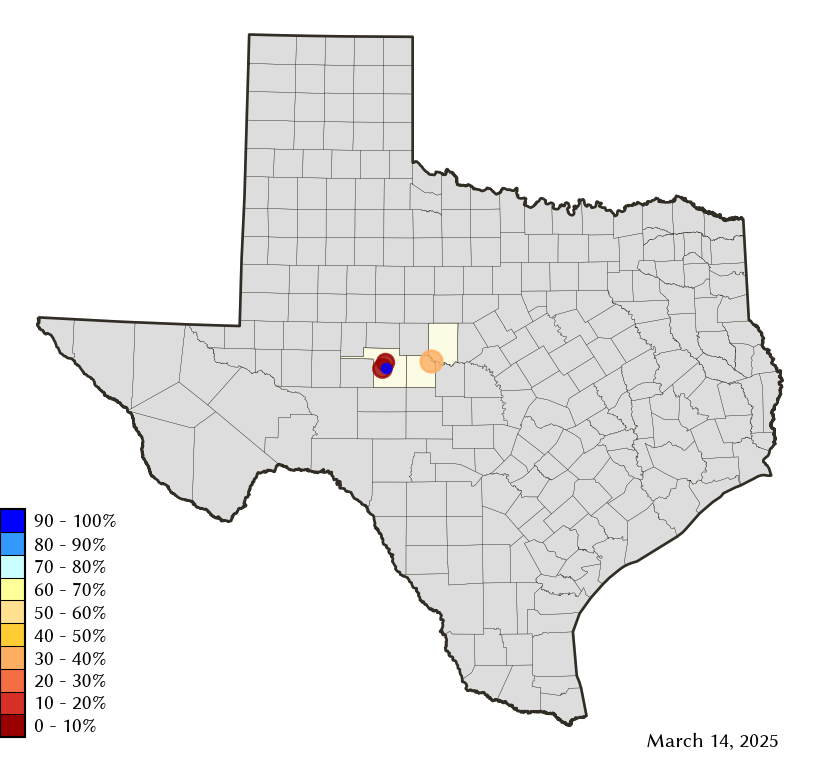
Area Map
Reservoir Storage
| Reservoir | Type | Percent Full |
Water Level (ft) |
Height Above Conservation Pool (ft) |
Reservoir Storage (acre-ft) |
Conservation Storage (acre-ft) |
Conservation Capacity (acre-ft) |
Surface Area (acres) |
|---|---|---|---|---|---|---|---|---|
| Nasworthy |

|
85.6 | 1,871.73 | -0.98 | 8,726 | 8,233 | 9,615 | 1,234 |
| O C Fisher |

|
12.6 | 1,874.01 | -33.99 | 14,570 | 14,569 | 115,742 | 1,228 |
| O H Ivie |
|
46.2 | 1,531.78 | -19.72 | 256,328 | 256,328 | 554,340 | - n.a. - |
| Twin Buttes |
|
7.7 | 1,899.62 | -40.58 | 17,832 | 14,083 | 182,454 | 1,332 |