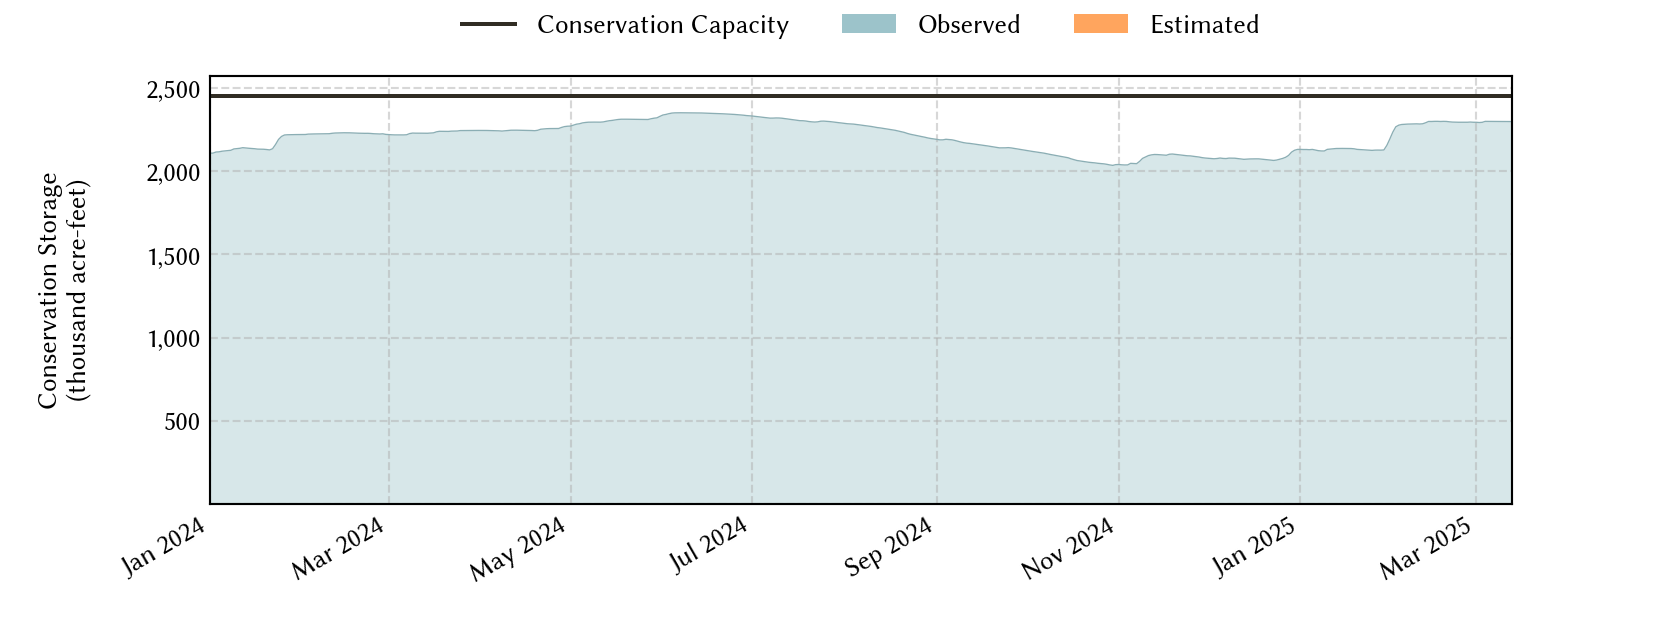
Fort Worth Area Reservoirs: Monitored Water Supply Reservoirs are 89.2% full on 2026-07-29
Historical Data
| Date | Percent Full |
Reservoir Storage (acre-ft) |
Conservation Storage (acre-ft) |
Conservation Capacity (acre-ft) |
|
|---|---|---|---|---|---|
| Today | 2026-07-29 | 89.2 | 2,222,541 | 2,187,551 | 2,451,597 |
| Yesterday | 2026-07-28 | 89.3 | 2,224,642 | 2,189,652 | 2,451,597 |
| 2 days ago | 2026-07-27 | 89.5 | 2,228,520 | 2,193,530 | 2,451,597 |
| 1 week ago | 2026-07-22 | 90.3 | 2,248,741 | 2,213,751 | 2,451,597 |
| 1 month ago | 2026-06-29 | 91.5 | 2,277,227 | 2,242,237 | 2,451,597 |
| 3 months ago | 2026-04-29 | 89.6 | 2,231,727 | 2,196,737 | 2,451,597 |
| 6 months ago | 2026-01-29 | 87.5 | 2,181,289 | 2,146,299 | 2,451,597 |
| 1 year ago | 2025-07-29 | 98.3 | 2,445,996 | 2,409,553 | 2,451,597 |
*
Percent Full is based on Conservation Storage and Conservation Capacity and doesn't account for storage in flood pool.
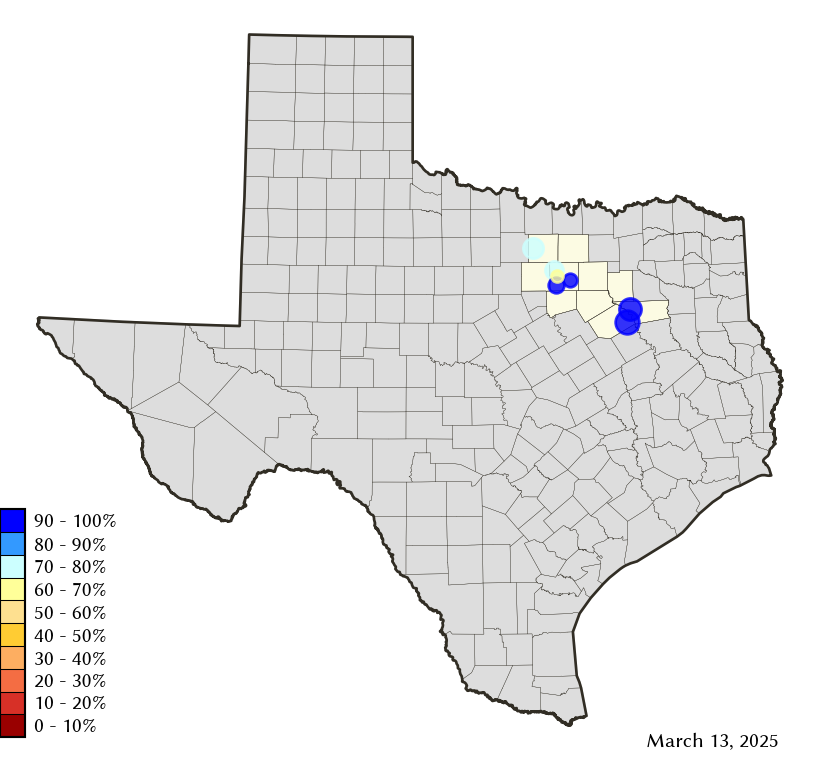
Area Map
Reservoir Storage
| Reservoir | Type | Percent Full |
Water Level (ft) |
Height Above Conservation Pool (ft) |
Reservoir Storage (acre-ft) |
Conservation Storage (acre-ft) |
Conservation Capacity (acre-ft) |
Surface Area (acres) |
|---|---|---|---|---|---|---|---|---|
| Arlington |

|
85.1 | 546.82 | -3.18 | 34,192 | 34,160 | 40,157 | 1,853 |
| Benbrook |

|
93.0 | 692.32 | -1.68 | 79,640 | 79,640 | 85,648 | 3,492 |
| Bridgeport |
|
84.1 | 830.93 | -5.07 | 312,868 | 312,868 | 372,183 | 11,154 |
| Cedar Creek |
|
82.1 | 318.27 | -3.73 | 529,669 | 529,570 | 644,686 | 29,196 |
| Eagle Mountain |
|
85.0 | 645.93 | -3.17 | 157,371 | 157,371 | 185,087 | 8,300 |
| Richland-Chambers |
|
96.0 | 313.98 | -1.02 | 1,080,864 | 1,055,081 | 1,099,417 | 43,059 |
| Worth |
|
77.2 | 592.33 | -1.67 | 27,937 | 18,861 | 24,419 | 3,228 |