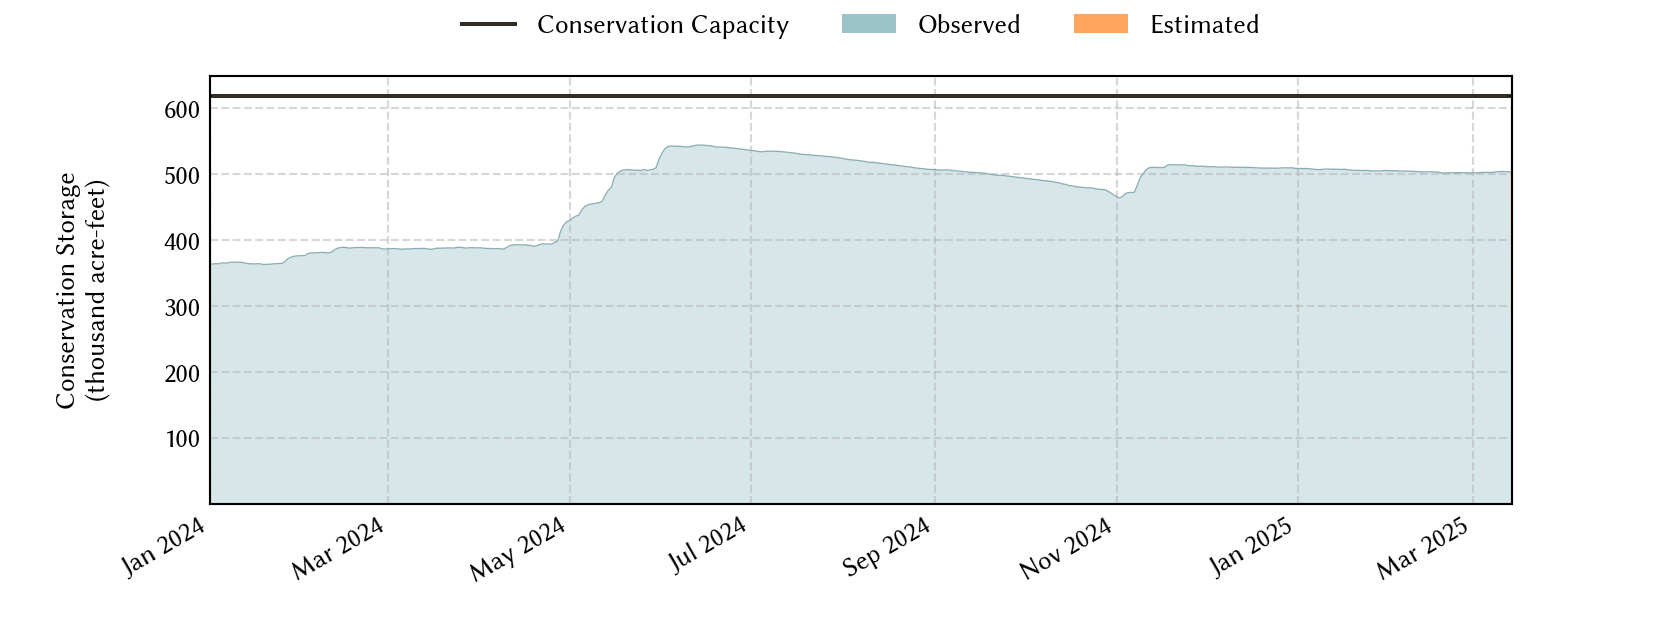
Region-B Planning Region Reservoirs: Monitored Water Supply Reservoirs are 81.7% full on 2026-07-30
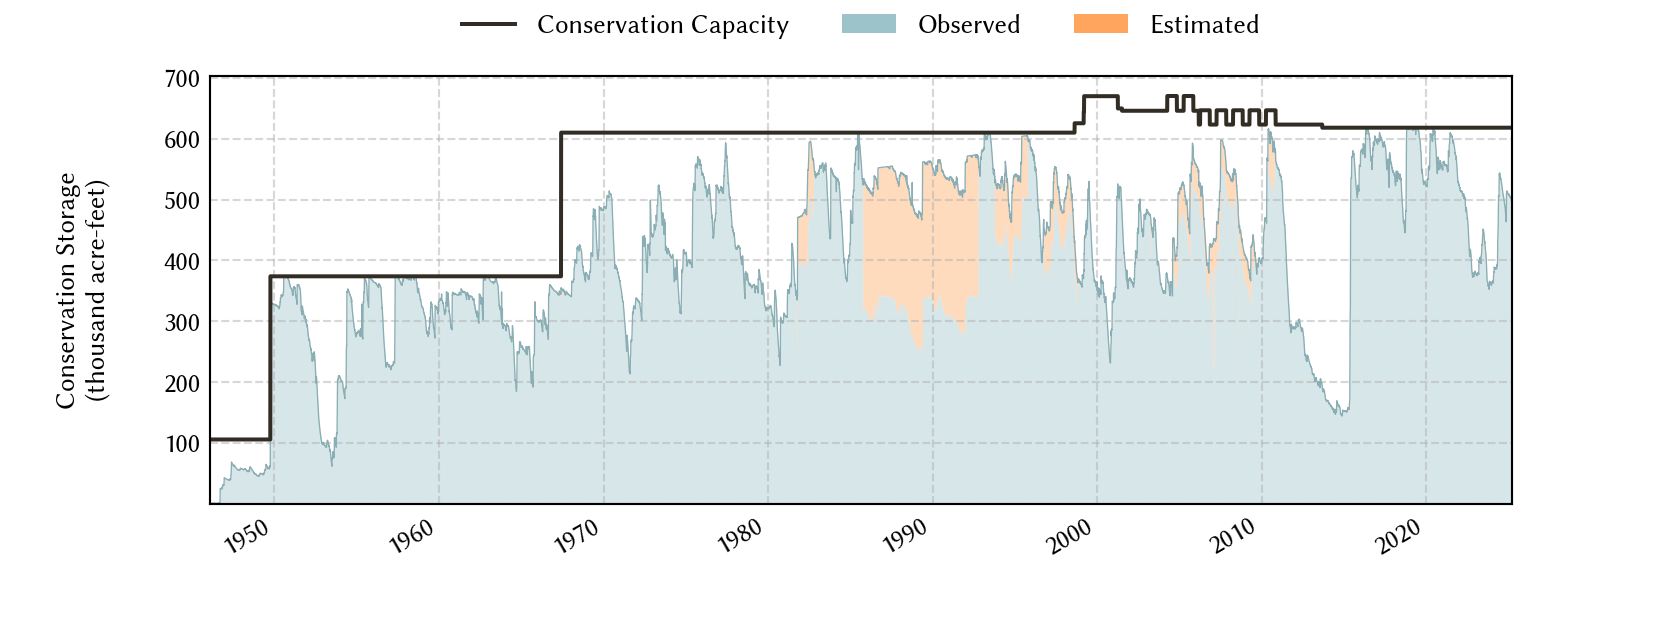
Historical Data
| Date | Percent Full |
Reservoir Storage (acre-ft) |
Conservation Storage (acre-ft) |
Conservation Capacity (acre-ft) |
|
|---|---|---|---|---|---|
| Today | 2026-07-30 | 81.7 | 506,429 | 505,215 | 618,121 |
| Yesterday | 2026-07-29 | 81.8 | 506,939 | 505,725 | 618,121 |
| 2 days ago | 2026-07-28 | 82.0 | 507,966 | 506,752 | 618,121 |
| 1 week ago | 2026-07-23 | 82.8 | 512,770 | 511,556 | 618,121 |
| 1 month ago | 2026-06-30 | 89.3 | 553,361 | 552,147 | 618,121 |
| 3 months ago | 2026-04-30 | 89.9 | 556,932 | 555,718 | 618,121 |
| 6 months ago | 2026-01-30 | 89.0 | 551,193 | 549,979 | 618,121 |
| 1 year ago | 2025-07-30 | 97.6 | 640,723 | 603,520 | 618,121 |
*
Percent Full is based on Conservation Storage and Conservation Capacity and doesn't account for storage in flood pool.
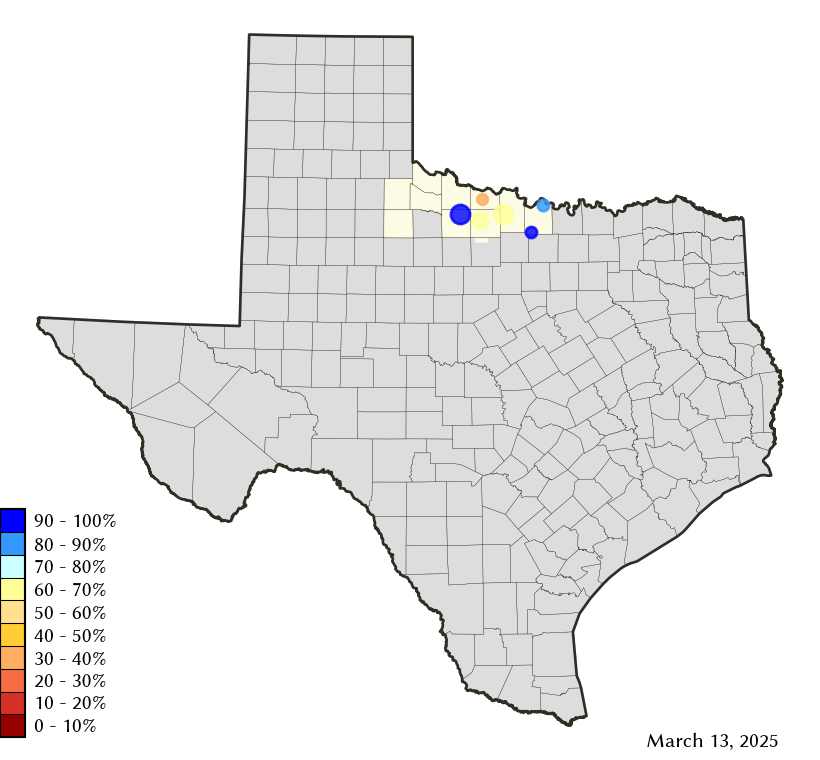
Area Map
Reservoir Storage
| Reservoir | Type | Percent Full |
Water Level (ft) |
Height Above Conservation Pool (ft) |
Reservoir Storage (acre-ft) |
Conservation Storage (acre-ft) |
Conservation Capacity (acre-ft) |
Surface Area (acres) |
|---|---|---|---|---|---|---|---|---|
| Amon G Carter |

|
84.2 | 917.83 | -2.17 | 17,012 | 16,228 | 19,266 | 1,327 |
| Arrowhead |
|
78.6 | 922.37 | -3.63 | 181,101 | 181,101 | 230,359 | 12,634 |
| Kemp |

|
82.8 | 1,141.68 | -2.32 | 203,278 | 203,152 | 245,307 | 11,423 |
| Kickapoo |
|
86.2 | 1,042.88 | -2.12 | 74,424 | 74,424 | 86,345 | 5,382 |
| Nocona |
|
79.8 | 824.12 | -3.38 | 17,424 | 17,120 | 21,444 | 1,215 |
| North Fork Buffalo Creek |
|
85.6 | 1,046.61 | -1.39 | 13,190 | 13,190 | 15,400 | 1,363 |