Austin Area Reservoirs: Monitored Water Supply Reservoirs are 99.8% full on 2026-07-30
Historical Data
| Date | Percent Full |
Reservoir Storage (acre-ft) |
Conservation Storage (acre-ft) |
Conservation Capacity (acre-ft) |
|
|---|---|---|---|---|---|
| Today | 2026-07-30 | 99.8 | 2,265,456 | 2,227,382 | 2,232,539 |
| Yesterday | 2026-07-29 | 99.8 | 2,265,554 | 2,227,606 | 2,232,539 |
| 2 days ago | 2026-07-28 | 99.8 | 2,265,777 | 2,227,606 | 2,232,539 |
| 1 week ago | 2026-07-23 | 99.8 | 2,298,428 | 2,227,158 | 2,232,539 |
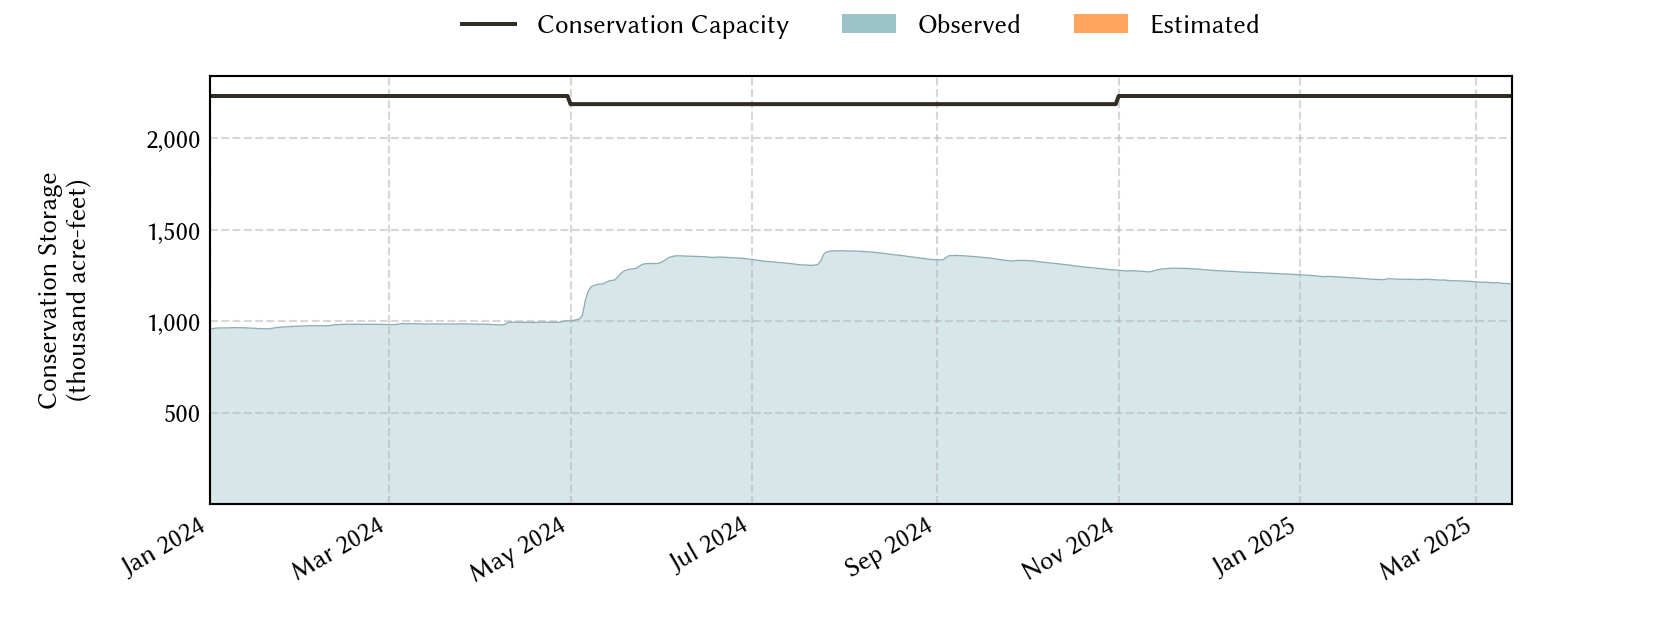
| 1 month ago | 2026-06-30 | 92.8 | 2,118,333 | 2,072,572 | 2,232,539 |
| 3 months ago | 2026-04-30 | 85.2 | 1,933,817 | 1,902,974 | 2,232,539 |
| 6 months ago | 2026-01-30 | 85.9 | 1,948,656 | 1,917,813 | 2,232,539 |
| 1 year ago | 2025-07-30 | 95.3 | 2,180,212 | 2,127,731 | 2,232,539 |
*
Percent Full is based on Conservation Storage and Conservation Capacity and doesn't account for storage in flood pool.
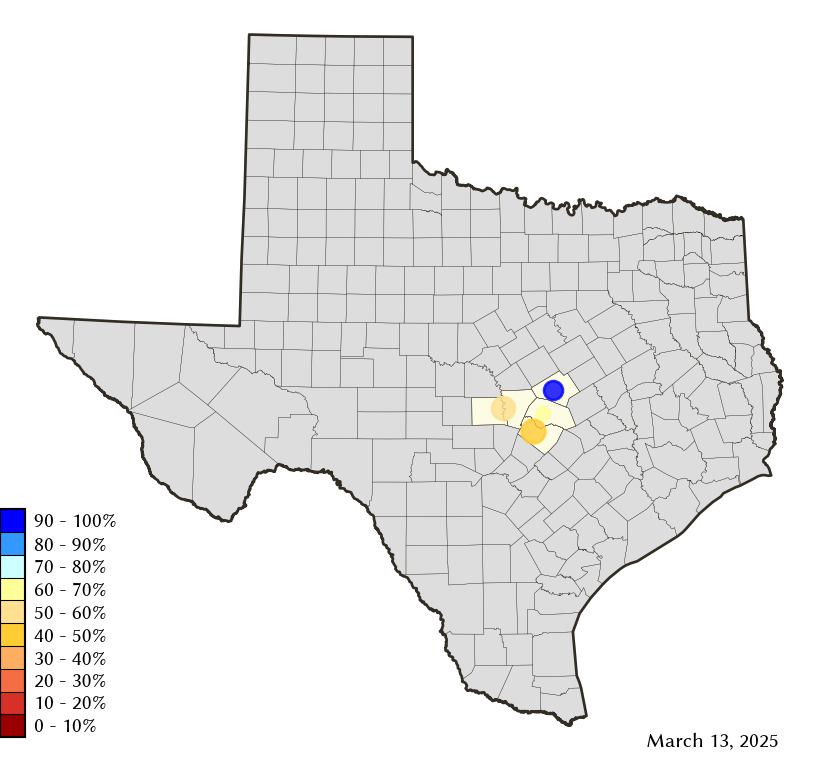
Area Map
Reservoir Storage
| Reservoir | Type | Percent Full |
Water Level (ft) |
Height Above Conservation Pool (ft) |
Reservoir Storage (acre-ft) |
Conservation Storage (acre-ft) |
Conservation Capacity (acre-ft) |
Surface Area (acres) |
|---|---|---|---|---|---|---|---|---|
| Buchanan |

|
99.4 | 1,019.77 | -0.23 | 875,199 | 861,537 | 866,694 | 22,398 |
| Georgetown |

|
100.0 | 791.60 | 0.60 | 38,858 | 38,005 | 38,005 | - n.a. - |
| Stillhouse Hollow |
|
100.0 | 622.70 | 0.70 | 234,417 | 229,796 | 229,796 | - n.a. - |
| Travis |
|
100.0 | 681.10 | 0.10 | 1,116,982 | 1,098,044 | 1,098,044 | 19,068 |