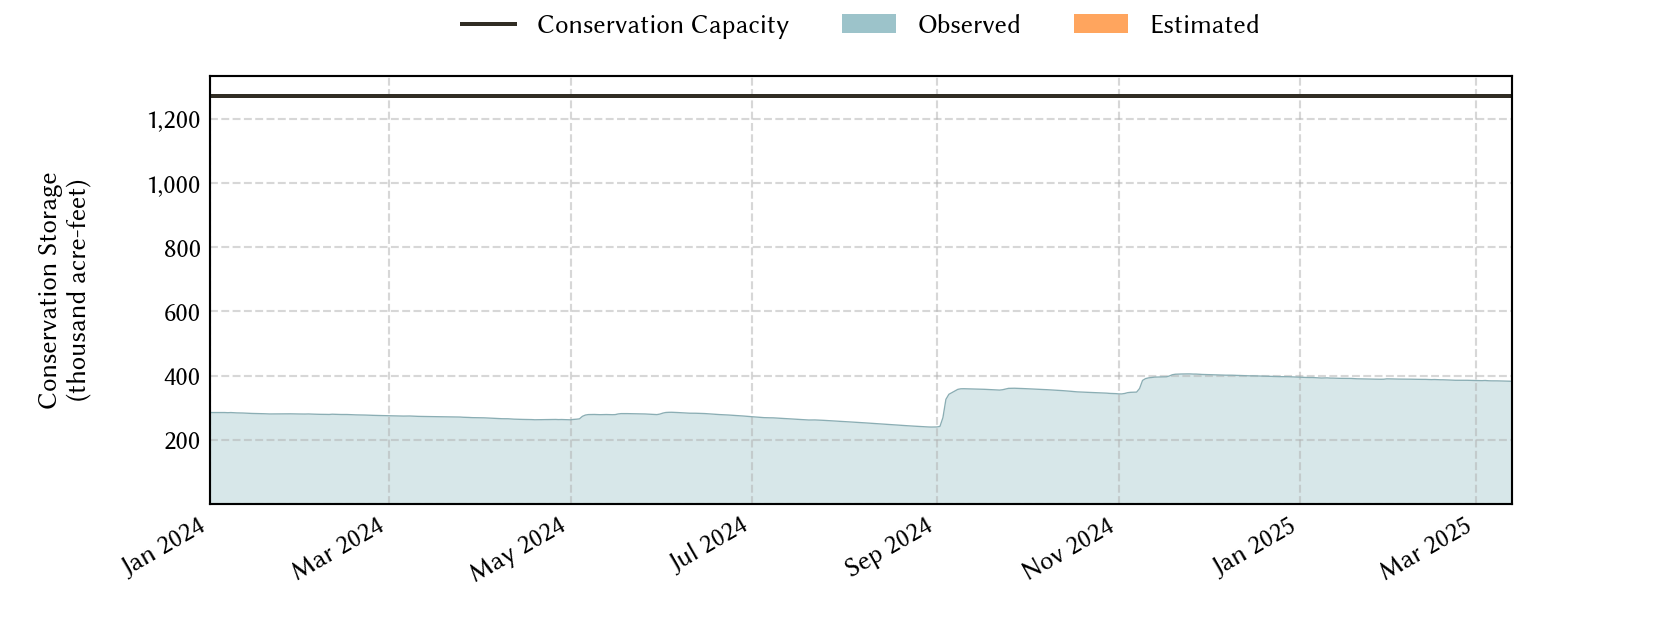
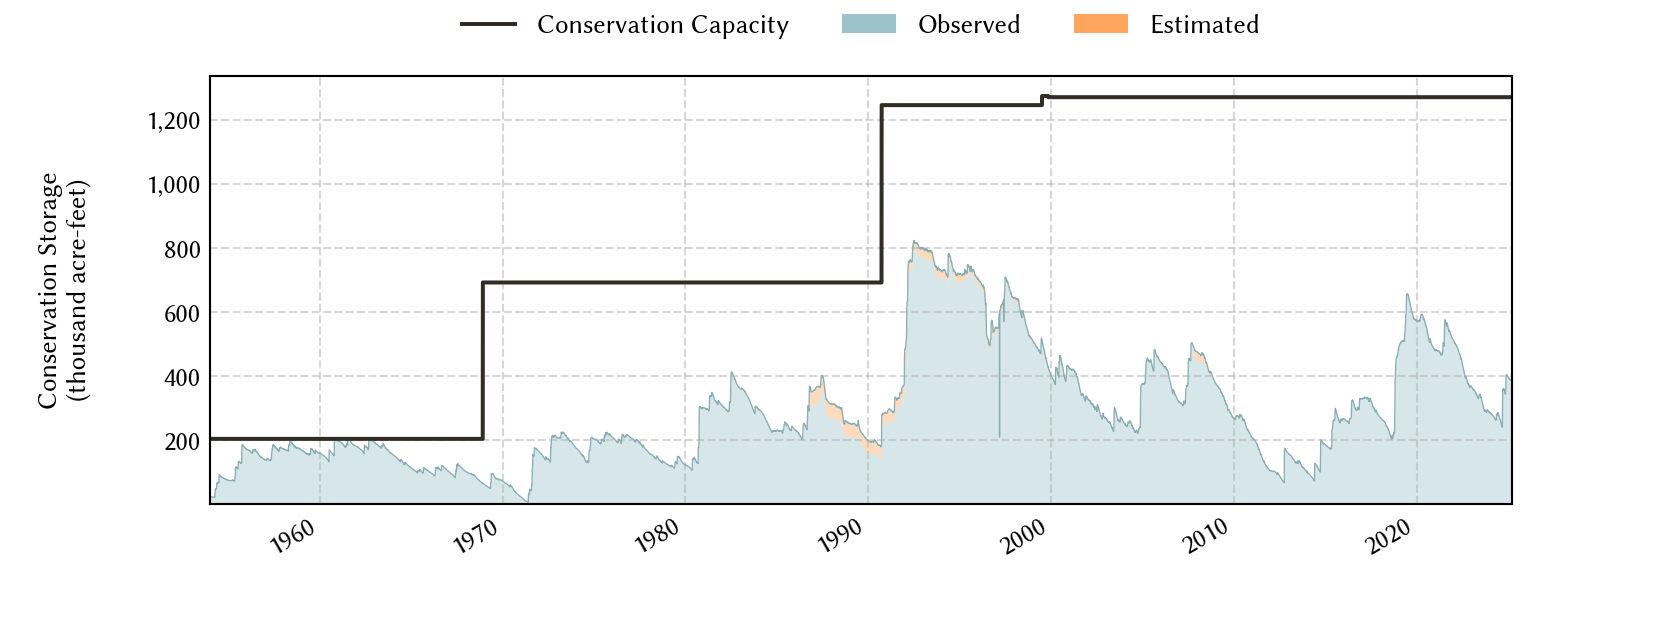
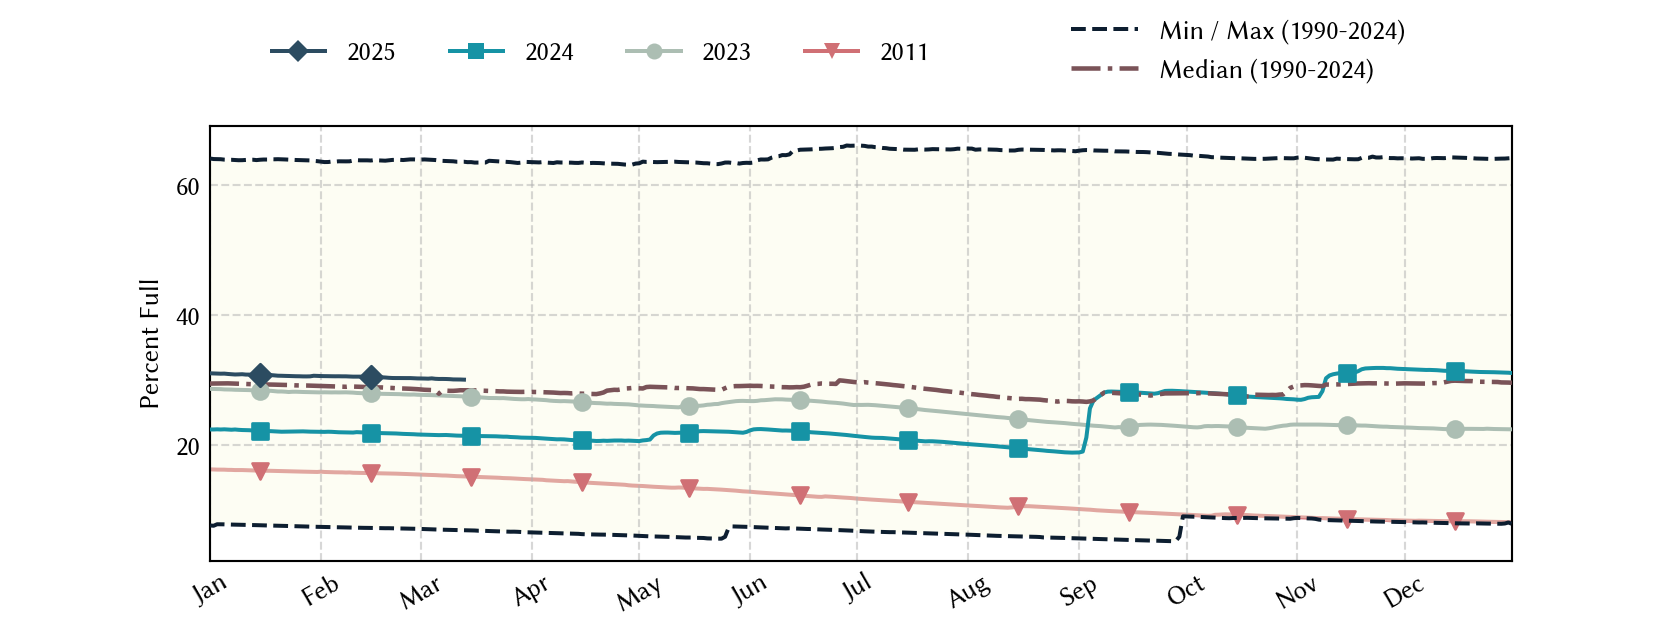
Midland Odessa Area Reservoirs: Monitored Water Supply Reservoirs are 28.3% full on 2026-07-30
Historical Data
| Date | Percent Full |
Reservoir Storage (acre-ft) |
Conservation Storage (acre-ft) |
Conservation Capacity (acre-ft) |
|
|---|---|---|---|---|---|
| Today | 2026-07-30 | 28.3 | 360,310 | 359,637 | 1,271,543 |
| Yesterday | 2026-07-29 | 28.3 | 360,853 | 360,180 | 1,271,543 |
| 2 days ago | 2026-07-28 | 28.4 | 361,496 | 360,823 | 1,271,543 |
| 1 week ago | 2026-07-23 | 28.6 | 364,915 | 364,242 | 1,271,543 |
| 1 month ago | 2026-06-30 | 28.9 | 367,989 | 367,316 | 1,271,543 |
| 3 months ago | 2026-04-30 | 29.2 | 371,907 | 371,234 | 1,271,543 |
| 6 months ago | 2026-01-30 | 29.8 | 379,786 | 379,113 | 1,271,543 |
| 1 year ago | 2025-07-30 | 35.6 | 452,873 | 452,200 | 1,271,543 |
*
Percent Full is based on Conservation Storage and Conservation Capacity and doesn't account for storage in flood pool.
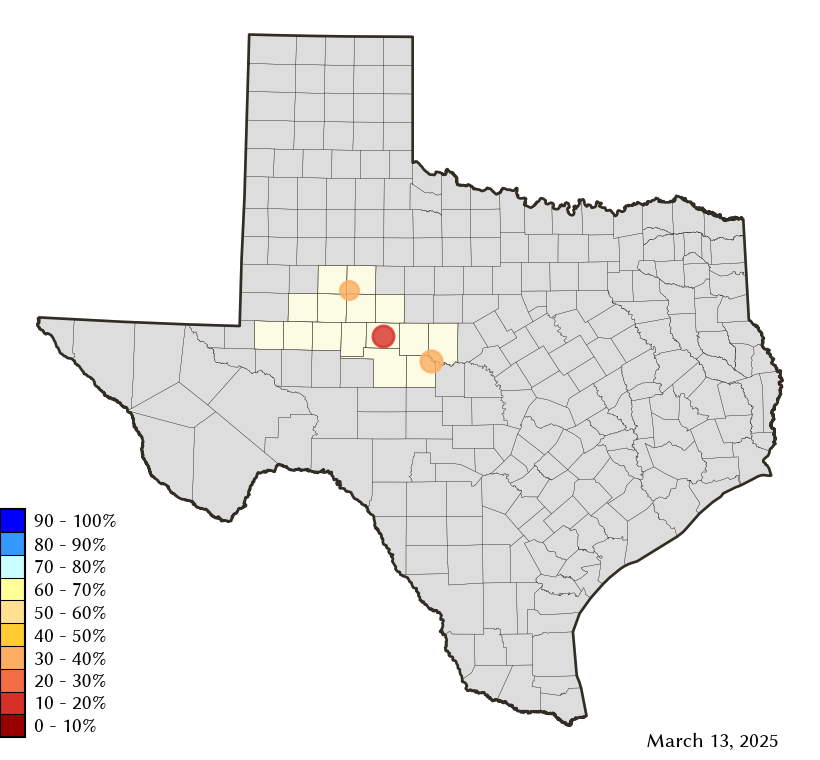
Area Map
Reservoir Storage
| Reservoir | Type | Percent Full |
Water Level (ft) |
Height Above Conservation Pool (ft) |
Reservoir Storage (acre-ft) |
Conservation Storage (acre-ft) |
Conservation Capacity (acre-ft) |
Surface Area (acres) |
|---|---|---|---|---|---|---|---|---|
| E V Spence |

|
10.8 | 1,844.30 | -53.70 | 55,644 | 55,644 | 517,272 | 3,549 |
| J B Thomas |
|
23.8 | 2,228.46 | -29.54 | 48,338 | 47,665 | 199,931 | 3,320 |
| O H Ivie |
|
46.2 | 1,531.78 | -19.72 | 256,328 | 256,328 | 554,340 | - n.a. - |