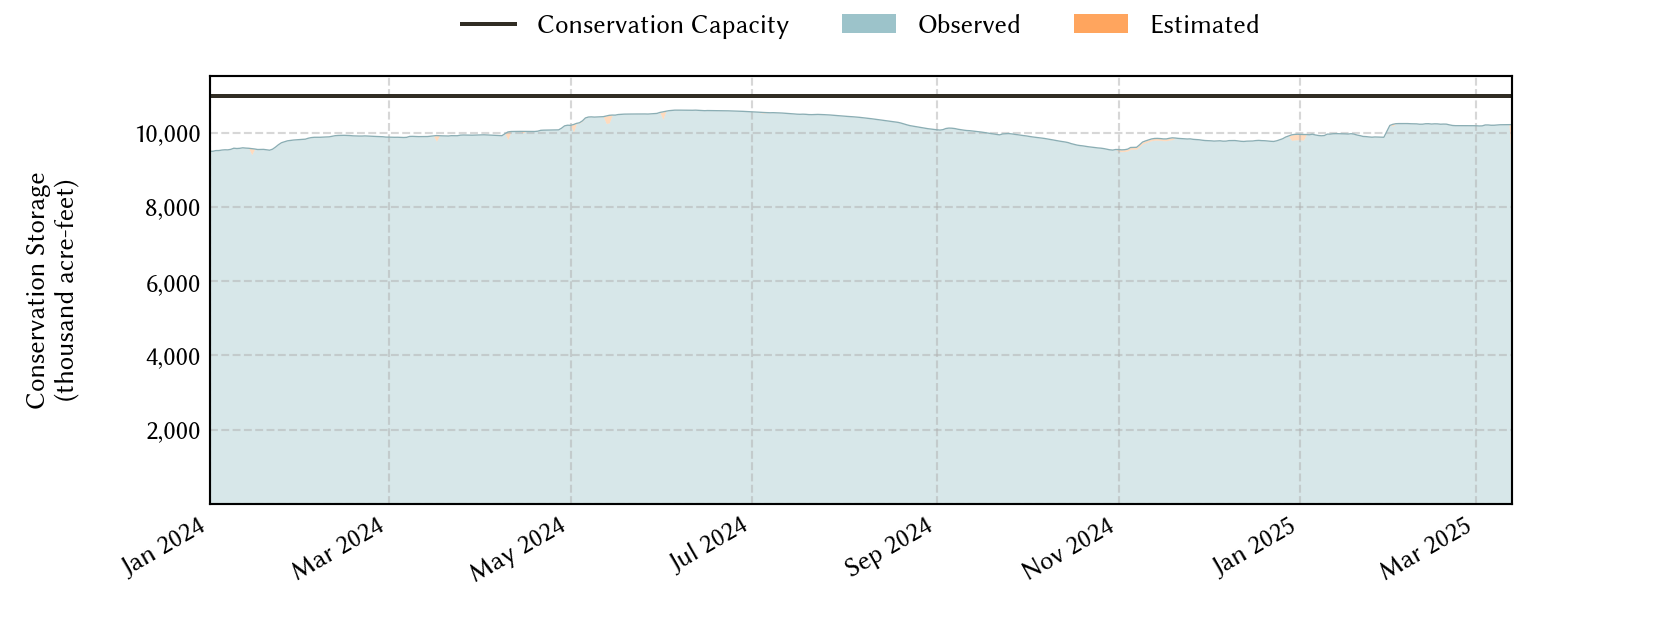
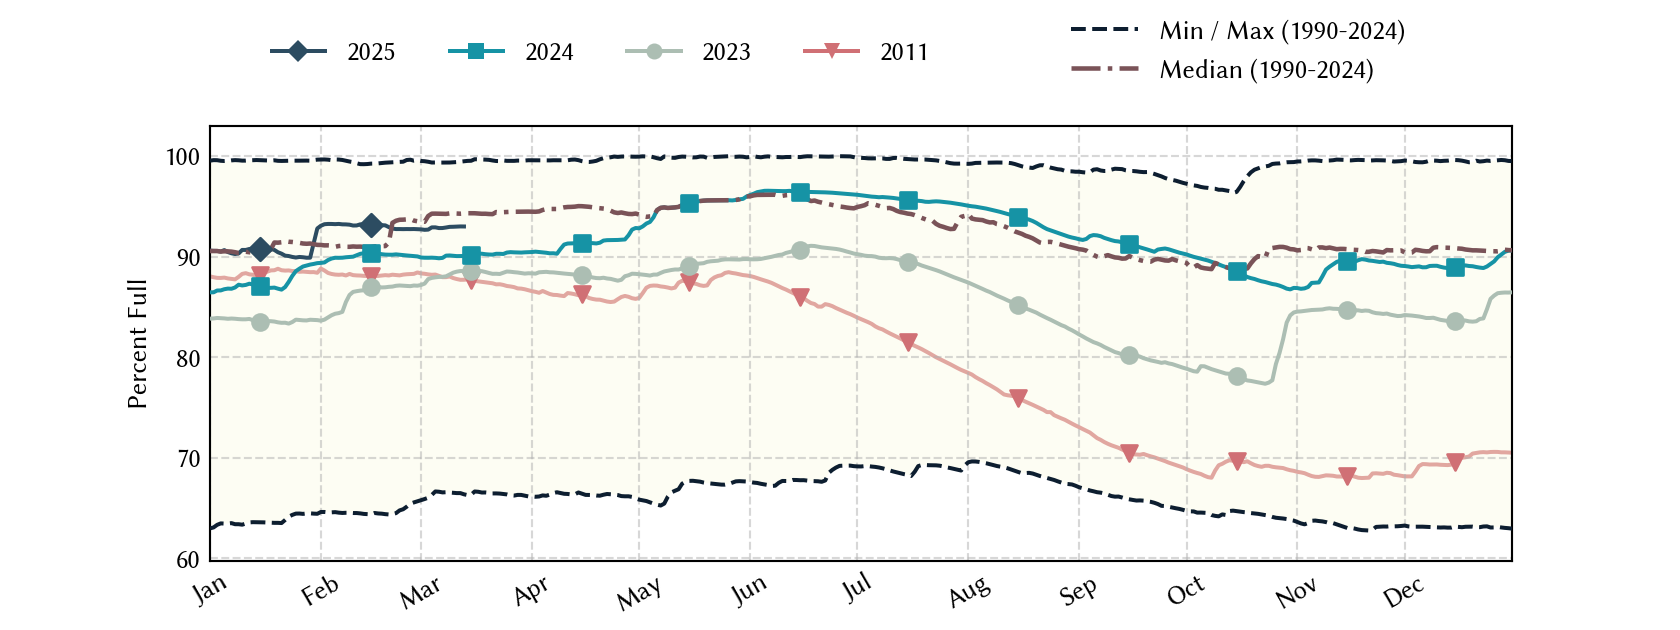
North-Central Climate Division Reservoirs: Monitored Water Supply Reservoirs are 94.0% full on 2026-07-30
Historical Data
| Date | Percent Full |
Reservoir Storage (acre-ft) |
Conservation Storage (acre-ft) |
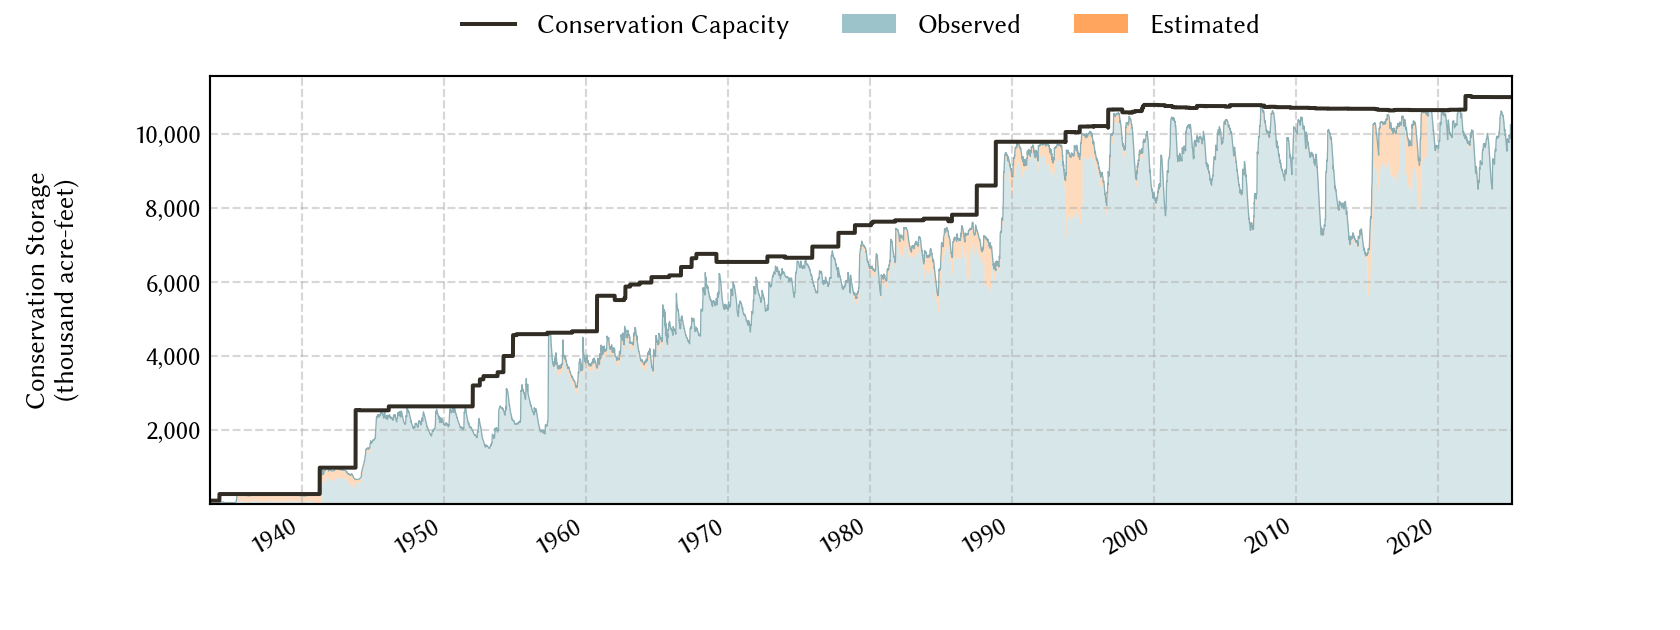
Conservation Capacity (acre-ft) |
|
|---|---|---|---|---|---|
| Today | 2026-07-30 | 94.0 | 11,815,395 | 10,329,286 | 10,983,823 |
| Yesterday | 2026-07-29 | 94.1 | 11,828,912 | 10,338,989 | 10,983,823 |
| 2 days ago | 2026-07-28 | 94.2 | 11,846,850 | 10,351,134 | 10,983,823 |
| 1 week ago | 2026-07-23 | 94.8 | 11,944,855 | 10,417,671 | 10,983,823 |
| 1 month ago | 2026-06-30 | 95.5 | 12,169,659 | 10,491,277 | 10,983,823 |
| 3 months ago | 2026-04-30 | 94.1 | 11,760,965 | 10,331,842 | 10,983,823 |
| 6 months ago | 2026-01-30 | 90.6 | 11,296,186 | 9,954,066 | 10,983,823 |
| 1 year ago | 2025-07-30 | 97.3 | 12,269,792 | 10,690,857 | 10,983,823 |
*
Percent Full is based on Conservation Storage and Conservation Capacity and doesn't account for storage in flood pool.
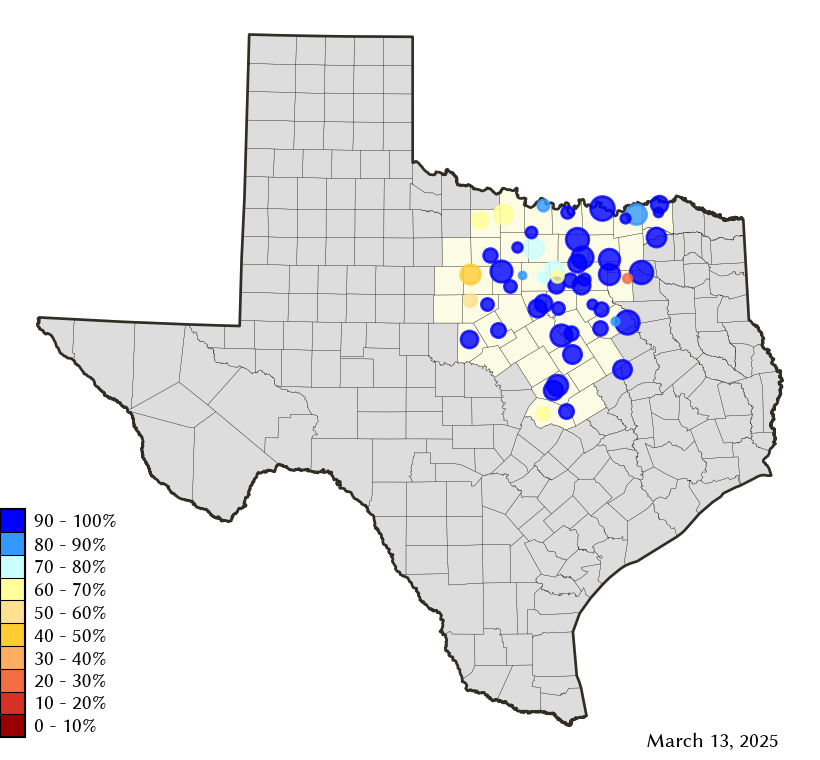
Area Map
Reservoir Storage
| Reservoir | Type | Percent Full |
Water Level (ft) |
Height Above Conservation Pool (ft) |
Reservoir Storage (acre-ft) |
Conservation Storage (acre-ft) |
Conservation Capacity (acre-ft) |
Surface Area (acres) |
|---|---|---|---|---|---|---|---|---|
| Amon G Carter |

|
84.2 | 917.83 | -2.17 | 17,012 | 16,228 | 19,266 | 1,327 |
| Aquilla |

|
99.6 | 537.44 | -0.06 | 43,094 | 43,058 | 43,243 | 3,078 |
| Arlington |
|
84.4 | 546.67 | -3.33 | 33,914 | 33,882 | 40,157 | 1,851 |
| Arrowhead |
|
78.6 | 922.37 | -3.63 | 181,101 | 181,101 | 230,359 | 12,634 |
| Bardwell |
|
98.2 | 420.76 | -0.24 | 43,131 | 43,070 | 43,856 | 3,261 |
| Belton |
|
100.0 | 594.80 | 0.80 | 442,671 | 432,631 | 432,631 | - n.a. - |
| Benbrook |
|
92.9 | 692.29 | -1.71 | 79,535 | 79,535 | 85,648 | 3,490 |
| Bois d'Arc |
|
98.4 | 533.64 | -0.36 | 361,823 | 361,823 | 367,609 | 16,370 |
| Bonham |
|
93.3 | 564.29 | -0.71 | 10,303 | 10,291 | 11,027 | 1,019 |
| Bridgeport |
|
84.0 | 830.91 | -5.09 | 312,645 | 312,645 | 372,183 | 11,150 |
| Brownwood |
|
91.7 | 1,423.27 | -1.33 | 120,049 | 120,049 | 130,868 | 6,458 |
| Cisco |
|
45.2 | 1,504.38 | -18.08 | 13,120 | 13,120 | 29,003 | 610 |
| Comanche Creek |
|
100.0 | 775.34 | 0.34 | 152,352 | 151,250 | 151,250 | - n.a. - |
| Crook |
|
97.1 | 475.74 | -0.26 | 8,939 | 8,924 | 9,195 | 1,041 |
| Eagle Mountain |
|
84.8 | 645.87 | -3.23 | 156,874 | 156,874 | 185,087 | 8,284 |
| Georgetown |
|
100.0 | 791.60 | 0.60 | 38,858 | 38,005 | 38,005 | - n.a. - |
| Graham |
|
73.4 | 1,069.74 | -5.26 | 33,276 | 33,262 | 45,288 | 2,064 |
| Granbury |
|
93.3 | 691.58 | -1.12 | 124,934 | 124,025 | 132,949 | 7,764 |
| Granger |
|
100.0 | 505.49 | 1.49 | 58,183 | 51,822 | 51,822 | - n.a. - |
| Grapevine |
|
99.7 | 534.92 | -0.08 | 162,537 | 162,537 | 163,064 | 6,601 |
| Halbert |
|
81.7 | 366.01 | -1.99 | 4,929 | 4,929 | 6,033 | 532 |
| Hubbard Creek |
|
40.7 | 1,167.86 | -15.45 | 132,373 | 127,497 | 313,298 | 8,634 |
| Hubert H Moss |
|
96.2 | 714.15 | -0.85 | 23,245 | 23,148 | 24,058 | 1,059 |
| Jim Chapman |
|
84.8 | 437.73 | -2.27 | 255,124 | 219,349 | 258,723 | 16,692 |
| Joe Pool |
|
98.2 | 521.59 | -0.41 | 148,279 | 146,909 | 149,629 | 6,586 |
| Kickapoo |
|
86.2 | 1,042.88 | -2.12 | 74,424 | 74,424 | 86,345 | 5,382 |
| Lavon |
|
96.5 | 491.29 | -0.71 | 398,070 | 395,229 | 409,757 | 20,315 |
| Leon |
|
84.6 | 1,372.42 | -2.58 | 23,774 | 23,494 | 27,762 | 1,553 |
| Lewisville |
|
97.7 | 521.51 | -0.49 | 585,750 | 550,076 | 563,228 | 26,661 |
| Limestone |
|
95.8 | 362.31 | -0.69 | 195,302 | 195,302 | 203,780 | 12,168 |
| Lost Creek |
|
92.6 | 1,007.25 | -2.25 | 11,070 | 11,070 | 11,950 | - n.a. - |
| Mineral Wells |
|
96.6 | 862.61 | -0.39 | 5,093 | 5,093 | 5,273 | 457 |
| Mountain Creek |
|
100.0 | 457.48 | 0.48 | 24,052 | 22,850 | 22,850 | 2,815 |
| Navarro Mills |
|
92.9 | 423.74 | -0.76 | 46,309 | 46,308 | 49,827 | 4,556 |
| New Terrell City |
|
29.8 | 494.66 | -9.34 | 2,565 | 2,554 | 8,583 | 402 |
| Nocona |
|
79.8 | 824.12 | -3.38 | 17,424 | 17,120 | 21,444 | 1,215 |
| Palo Pinto |
|
92.2 | 866.03 | -0.97 | 25,061 | 24,675 | 26,766 | 2,136 |
| Pat Cleburne |
|
94.5 | 732.58 | -0.92 | 24,581 | 24,581 | 26,008 | 1,537 |
| Pat Mayse |
|
100.0 | 451.20 | 0.20 | 118,973 | 113,683 | 113,683 | - n.a. - |
| Possum Kingdom |
|
93.7 | 997.06 | -1.94 | 504,248 | 504,248 | 538,139 | 17,019 |
| Proctor |
|
79.3 | 1,159.43 | -2.57 | 43,442 | 43,442 | 54,762 | 4,152 |
| Ray Hubbard |
|
96.4 | 434.73 | -0.77 | 423,730 | 423,730 | 439,559 | 20,291 |
| Ray Roberts |
|
99.4 | 632.34 | -0.16 | 783,960 | 783,637 | 788,167 | 28,261 |
| Richland-Chambers |
|
95.8 | 313.94 | -1.06 | 1,079,143 | 1,053,360 | 1,099,417 | 43,027 |
| Stillhouse Hollow |
|
100.0 | 622.70 | 0.70 | 234,417 | 229,796 | 229,796 | - n.a. - |
| Tawakoni |
|
98.5 | 437.14 | -0.36 | 858,449 | 858,441 | 871,685 | 36,576 |
| Texoma 1 |
|
100.0 | 618.19 | 1.19 | 2,579,611 | 1,243,801 | 1,243,801 | 79,326 |
| Waco |
|
97.6 | 461.67 | -0.55 | 184,502 | 184,276 | 188,891 | 8,342 |
| Waxahachie |
|
94.0 | 530.47 | -1.03 | 10,975 | 10,393 | 11,060 | 640 |
| Weatherford |
|
62.7 | 889.24 | -6.76 | 11,177 | 11,177 | 17,812 | 894 |
| Whitney |
|
99.5 | 532.87 | -0.13 | 563,152 | 561,798 | 564,808 | 23,100 |
| Worth |
|
76.8 | 592.30 | -1.70 | 27,840 | 18,764 | 24,419 | 3,224 |
footnotes
1
Lake Texoma straddles the border of Texas and Oklahoma, Texas has rights to 50% of Lake Texoma's total conservation capacity. Percent full, conservation storage and conservation capacity are based on the Texas share.