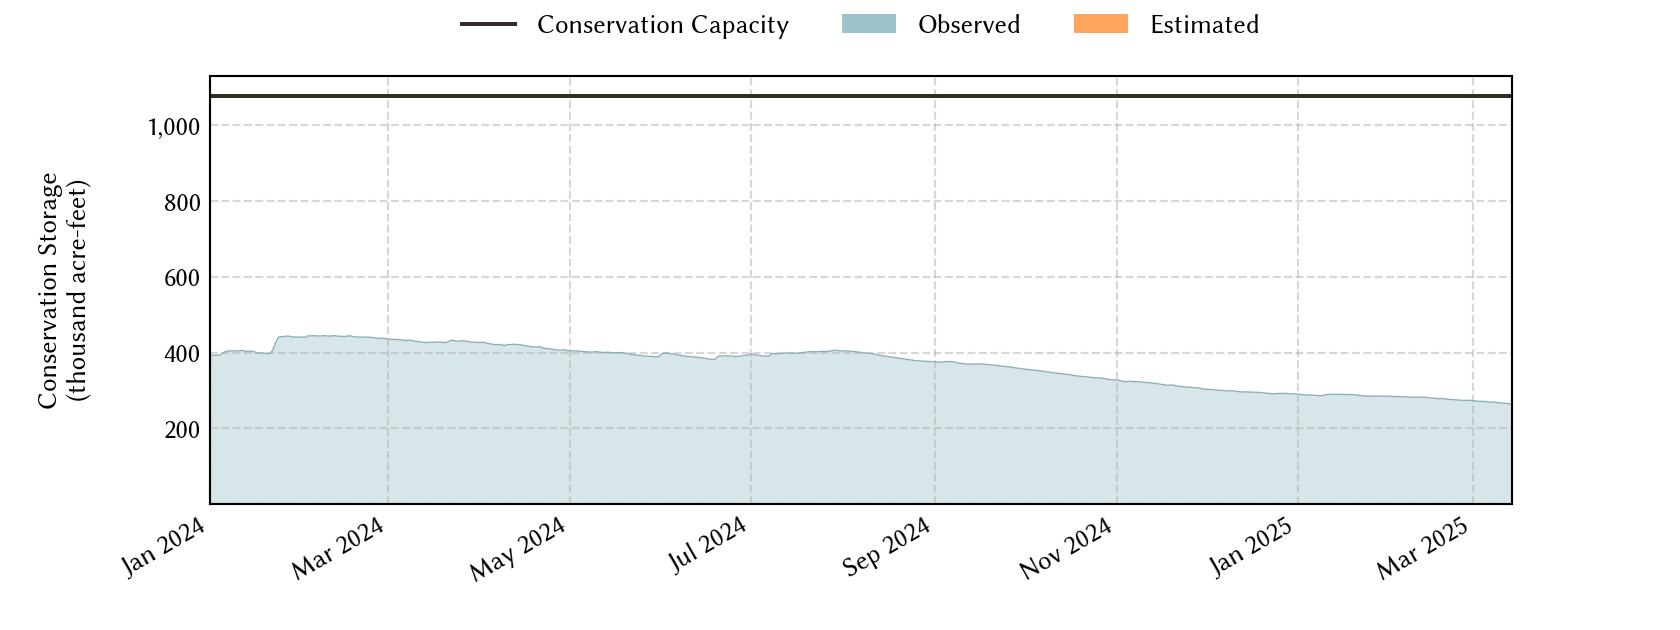
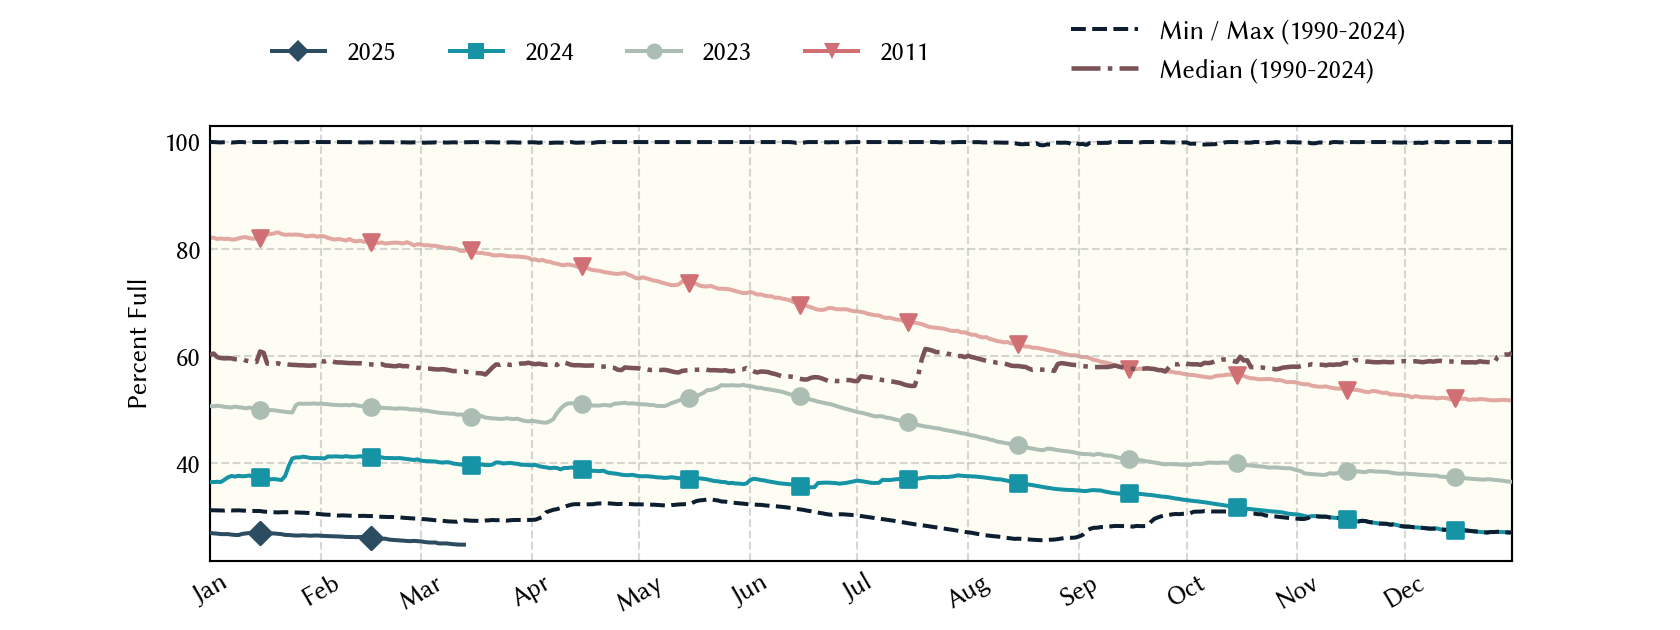
Corpus Christi Area Reservoirs: Monitored Water Supply Reservoirs are 37.7% full on 2026-07-30
Historical Data
| Date | Percent Full |
Reservoir Storage (acre-ft) |
Conservation Storage (acre-ft) |
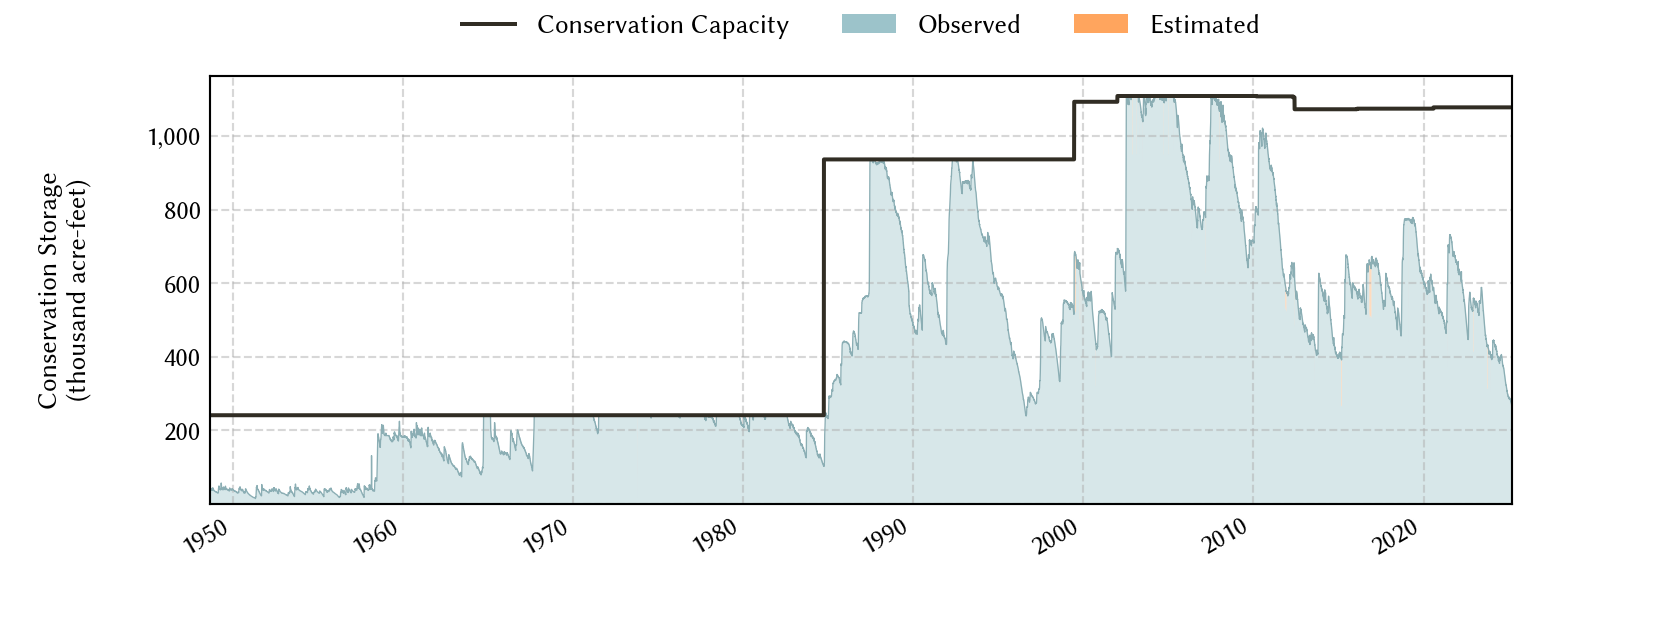
Conservation Capacity (acre-ft) |
|
|---|---|---|---|---|---|
| Today | 2026-07-30 | 37.7 | 412,205 | 406,713 | 1,077,857 |
| Yesterday | 2026-07-29 | 37.5 | 409,862 | 404,370 | 1,077,857 |
| 2 days ago | 2026-07-28 | 37.3 | 407,730 | 402,238 | 1,077,857 |
| 1 week ago | 2026-07-23 | 29.5 | 324,483 | 318,386 | 1,077,857 |
| 1 month ago | 2026-06-30 | 28.2 | 309,458 | 303,966 | 1,077,857 |
| 3 months ago | 2026-04-30 | 16.1 | 178,937 | 173,445 | 1,077,857 |
| 6 months ago | 2026-01-30 | 17.1 | 189,414 | 183,922 | 1,077,857 |
| 1 year ago | 2025-07-30 | 26.8 | 294,461 | 288,969 | 1,077,857 |
*
Percent Full is based on Conservation Storage and Conservation Capacity and doesn't account for storage in flood pool.
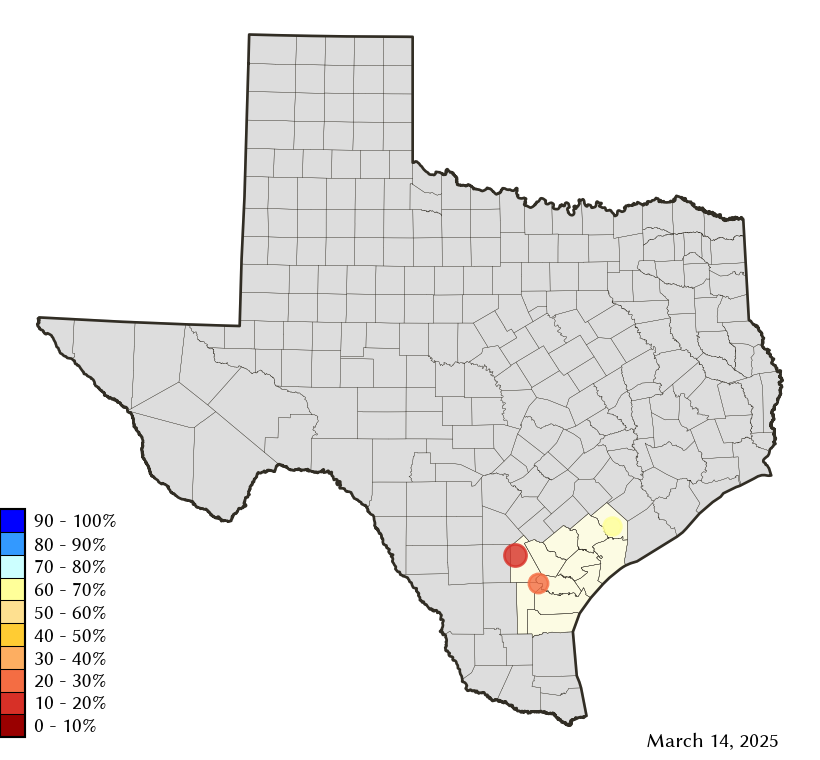
Area Map
Reservoir Storage
| Reservoir | Type | Percent Full |
Water Level (ft) |
Height Above Conservation Pool (ft) |
Reservoir Storage (acre-ft) |
Conservation Storage (acre-ft) |
Conservation Capacity (acre-ft) |
Surface Area (acres) |
|---|---|---|---|---|---|---|---|---|
| Choke Canyon |

|
24.9 | 192.86 | -27.64 | 164,971 | 164,970 | 662,820 | 11,084 |
| Corpus Christi |
|
33.6 | 83.25 | -10.75 | 86,210 | 85,932 | 256,062 | 11,123 |
| Texana |
|
98.0 | 43.69 | -0.31 | 161,024 | 155,811 | 158,975 | 10,140 |