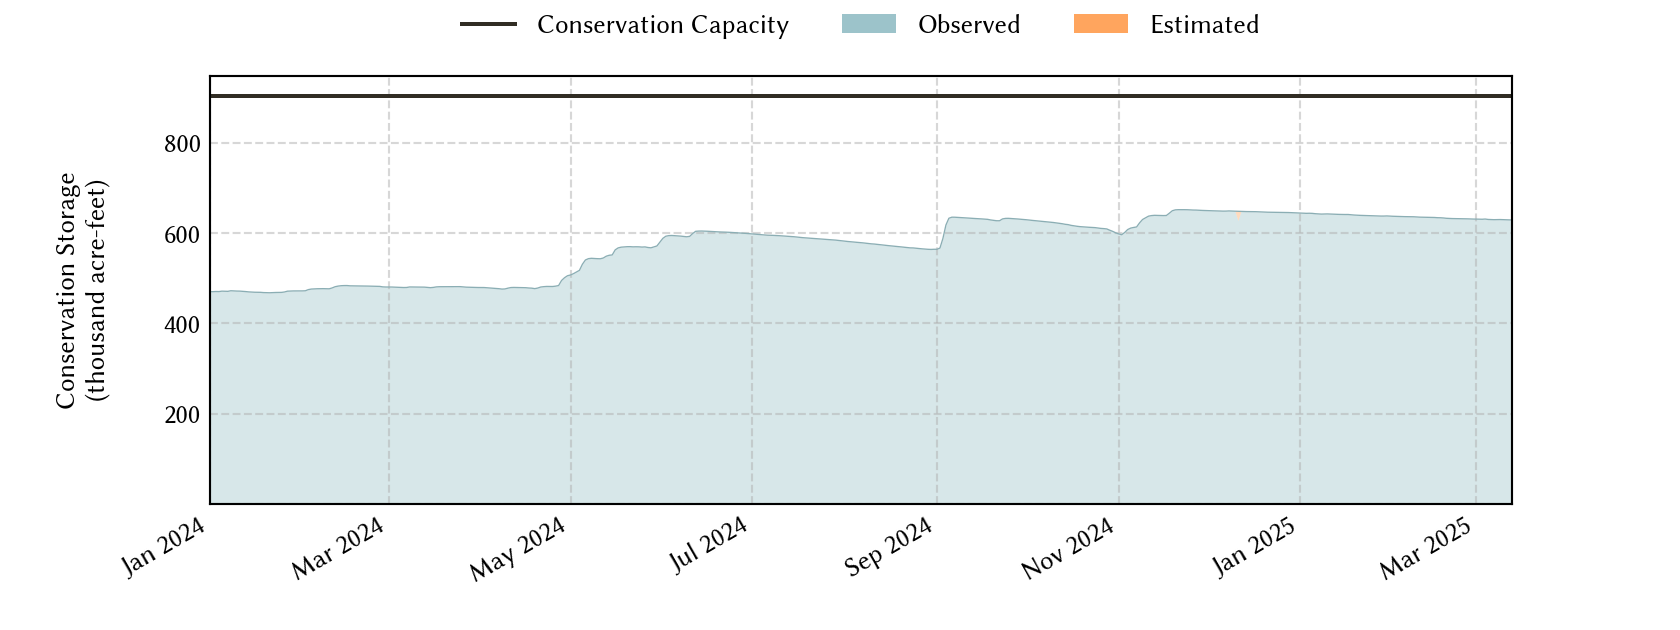
Low-Rolling-Plains Climate Division Reservoirs: Monitored Water Supply Reservoirs are 58.2% full on 2026-07-30
Historical Data
| Date | Percent Full |
Reservoir Storage (acre-ft) |
Conservation Storage (acre-ft) |
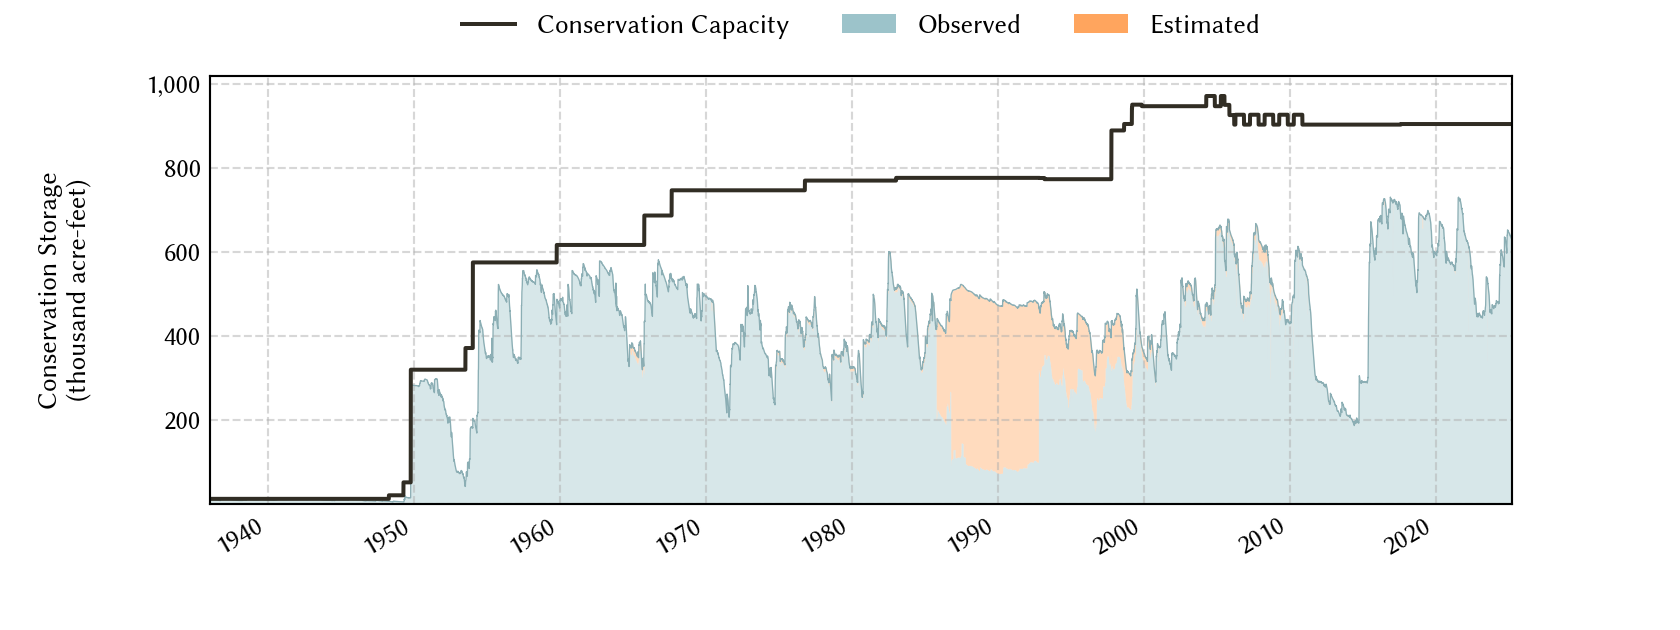
Conservation Capacity (acre-ft) |
|
|---|---|---|---|---|---|
| Today | 2026-07-30 | 58.2 | 528,358 | 525,814 | 903,870 |
| Yesterday | 2026-07-29 | 58.2 | 528,911 | 526,367 | 903,870 |
| 2 days ago | 2026-07-28 | 58.4 | 529,965 | 527,421 | 903,870 |
| 1 week ago | 2026-07-23 | 58.9 | 535,162 | 532,618 | 903,870 |
| 1 month ago | 2026-06-30 | 61.2 | 555,674 | 553,130 | 903,870 |
| 3 months ago | 2026-04-30 | 62.4 | 566,531 | 563,987 | 903,870 |
| 6 months ago | 2026-01-30 | 64.5 | 585,340 | 582,796 | 903,870 |
| 1 year ago | 2025-07-30 | 72.0 | 691,074 | 650,822 | 903,870 |
*
Percent Full is based on Conservation Storage and Conservation Capacity and doesn't account for storage in flood pool.
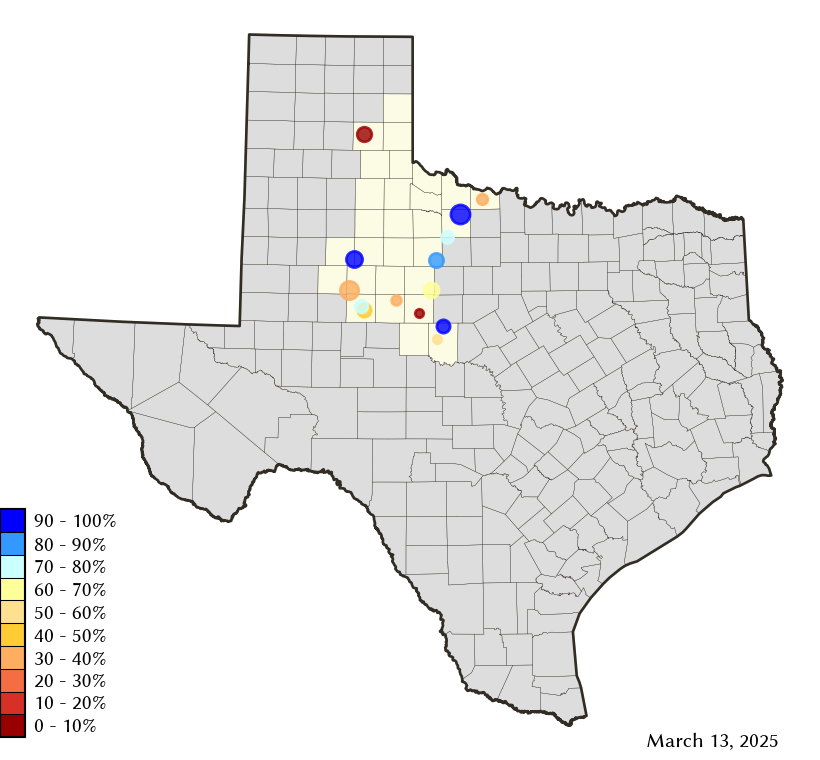
Area Map
Reservoir Storage
| Reservoir | Type | Percent Full |
Water Level (ft) |
Height Above Conservation Pool (ft) |
Reservoir Storage (acre-ft) |
Conservation Storage (acre-ft) |
Conservation Capacity (acre-ft) |
Surface Area (acres) |
|---|---|---|---|---|---|---|---|---|
| Abilene |

|
12.9 | 1,994.24 | -18.06 | 1,020 | 1,020 | 7,900 | 175 |
| Alan Henry |
|
76.2 | 2,210.82 | -9.18 | 73,337 | 73,337 | 96,207 | 2,227 |
| Champion Creek |
|
45.0 | 2,063.74 | -19.26 | 18,728 | 18,728 | 41,580 | 889 |
| Coleman |
|
84.5 | 1,714.15 | -3.35 | 32,207 | 32,189 | 38,075 | 1,696 |
| Colorado City |
|
57.9 | 2,060.13 | -10.07 | 17,801 | 17,801 | 30,758 | - n.a. - |
| Fort Phantom Hill |
|
75.1 | 1,630.98 | -4.92 | 52,623 | 52,617 | 70,030 | 3,178 |
| Greenbelt |
|
5.7 | 2,609.13 | -54.87 | 3,840 | 3,408 | 59,968 | 308 |
| Hords Creek |

|
51.0 | 1,889.93 | -10.07 | 4,136 | 4,133 | 8,109 | 296 |
| J B Thomas |
|
23.8 | 2,228.46 | -29.54 | 48,338 | 47,665 | 199,931 | 3,320 |
| Kemp |
|
82.8 | 1,141.68 | -2.32 | 203,278 | 203,152 | 245,307 | 11,423 |
| Millers Creek |
|
66.3 | 1,329.20 | -4.80 | 19,039 | 17,756 | 26,768 | 1,531 |
| North Fork Buffalo Creek |
|
85.6 | 1,046.61 | -1.39 | 13,190 | 13,190 | 15,400 | 1,363 |
| Stamford |
|
74.5 | 1,414.19 | -2.61 | 38,426 | 38,423 | 51,570 | 4,128 |
| Sweetwater |
|
19.5 | 2,092.17 | -24.33 | 2,395 | 2,395 | 12,267 | 223 |