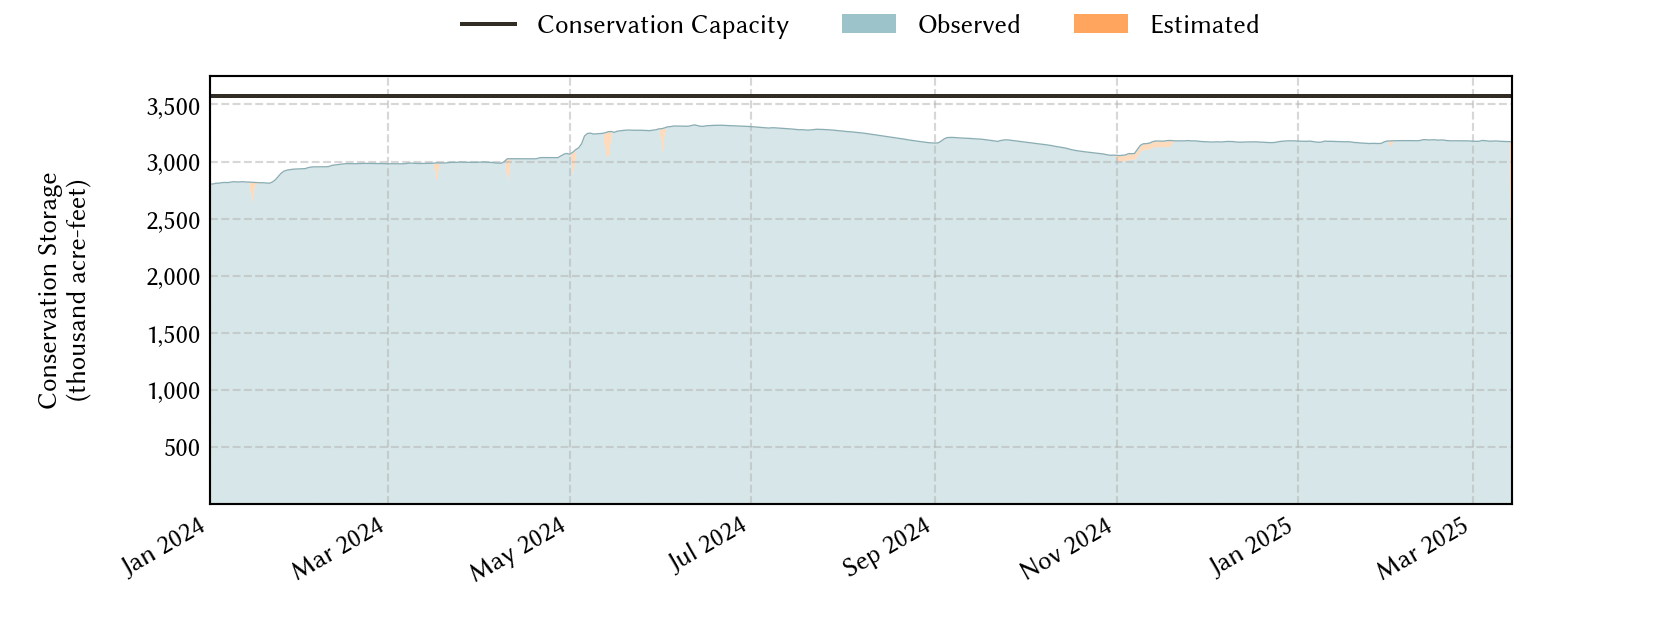
Brazos River Basin Reservoirs: Monitored Water Supply Reservoirs are 89.0% full on 2026-07-29
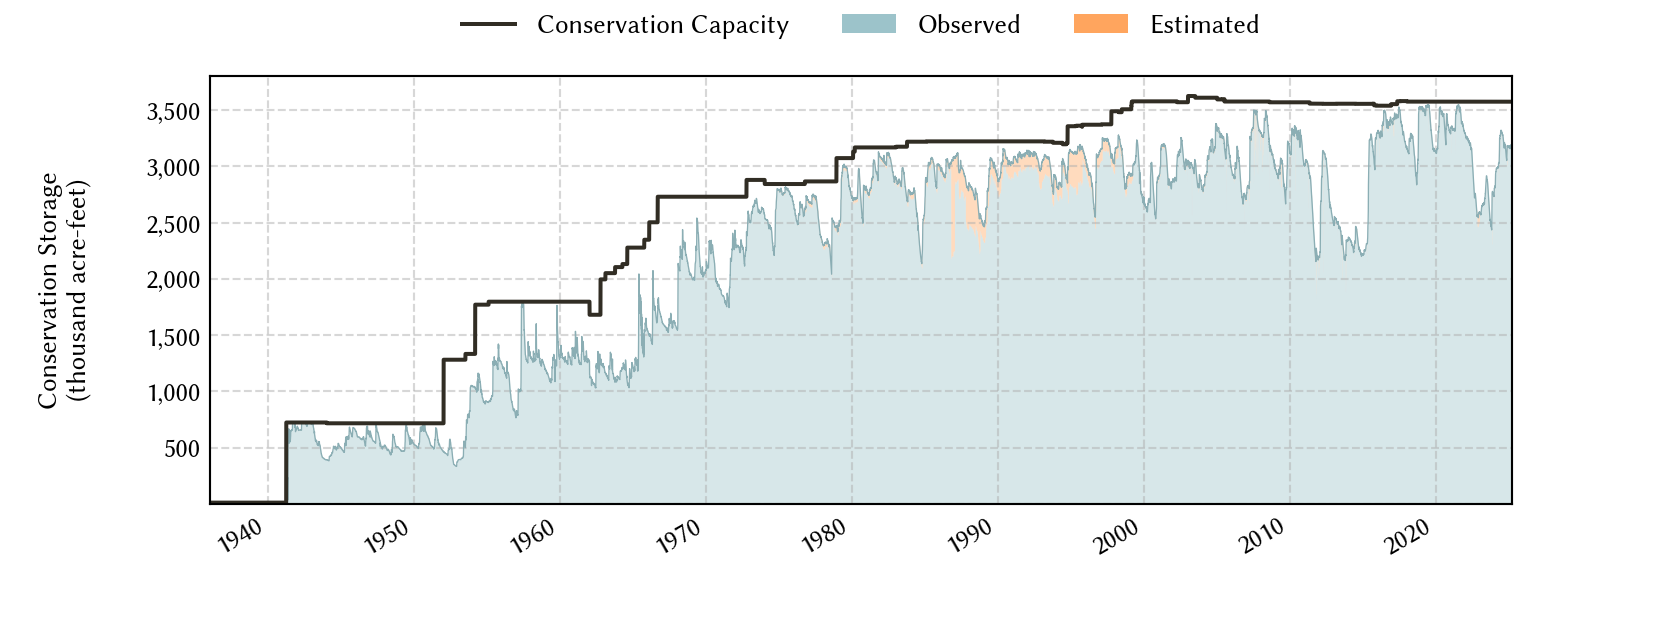
Historical Data
| Date | Percent Full |
Reservoir Storage (acre-ft) |
Conservation Storage (acre-ft) |
Conservation Capacity (acre-ft) |
|
|---|---|---|---|---|---|
| Today | 2026-07-29 | 89.0 | 3,235,016 | 3,183,403 | 3,576,076 |
| Yesterday | 2026-07-28 | 89.1 | 3,238,902 | 3,185,340 | 3,576,076 |
| 2 days ago | 2026-07-27 | 89.2 | 3,245,215 | 3,188,342 | 3,576,076 |
| 1 week ago | 2026-07-22 | 89.6 | 3,279,910 | 3,203,906 | 3,576,076 |
| 1 month ago | 2026-06-29 | 89.8 | 3,285,448 | 3,210,984 | 3,576,076 |
| 3 months ago | 2026-04-29 | 87.9 | 3,168,369 | 3,143,117 | 3,576,076 |
| 6 months ago | 2026-01-29 | 86.1 | 3,092,238 | 3,080,665 | 3,576,076 |
| 1 year ago | 2025-07-29 | 93.5 | 3,466,534 | 3,343,419 | 3,576,076 |
*
Percent Full is based on Conservation Storage and Conservation Capacity and doesn't account for storage in flood pool.
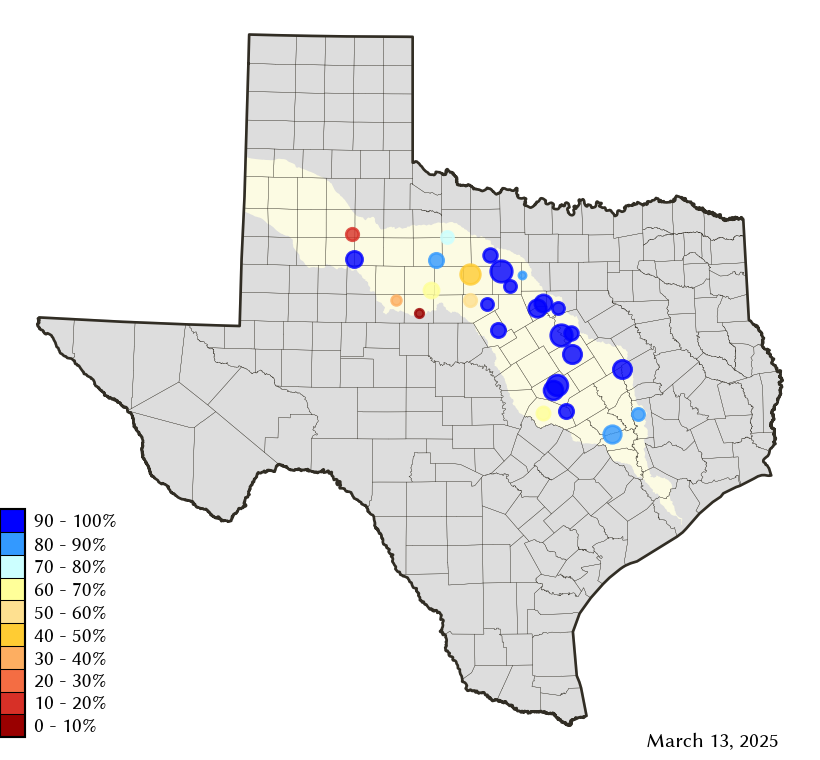
Area Map
Reservoir Storage
| Reservoir | Type | Percent Full |
Water Level (ft) |
Height Above Conservation Pool (ft) |
Reservoir Storage (acre-ft) |
Conservation Storage (acre-ft) |
Conservation Capacity (acre-ft) |
Surface Area (acres) |
|---|---|---|---|---|---|---|---|---|
| Abilene |

|
13.0 | 1,994.29 | -18.01 | 1,028 | 1,028 | 7,900 | 176 |
| Alan Henry |
|
76.3 | 2,210.85 | -9.15 | 73,404 | 73,404 | 96,207 | 2,229 |
| Aquilla |

|
99.9 | 537.48 | -0.02 | 43,217 | 43,181 | 43,243 | 3,082 |
| Belton |
|
100.0 | 594.84 | 0.84 | 443,177 | 432,631 | 432,631 | - n.a. - |
| Cisco |
|
45.3 | 1,504.41 | -18.05 | 13,138 | 13,138 | 29,003 | 610 |
| Comanche Creek |
|
100.0 | 775.35 | 0.35 | 152,384 | 151,250 | 151,250 | - n.a. - |
| Fort Phantom Hill |
|
75.3 | 1,631.01 | -4.89 | 52,718 | 52,712 | 70,030 | 3,182 |
| Georgetown |
|
100.0 | 791.72 | 0.72 | 39,017 | 38,005 | 38,005 | - n.a. - |
| Gibbons Creek |
|
96.6 | 246.66 | -0.34 | 26,563 | 24,859 | 25,721 | 2,516 |
| Graham |
|
73.6 | 1,069.77 | -5.23 | 33,338 | 33,324 | 45,288 | 2,066 |
| Granbury |
|
93.6 | 691.63 | -1.07 | 125,323 | 124,414 | 132,949 | 7,782 |
| Granger |
|
100.0 | 505.58 | 1.58 | 58,582 | 51,822 | 51,822 | - n.a. - |
| Hubbard Creek |
|
40.8 | 1,167.90 | -15.41 | 132,719 | 127,843 | 313,298 | 8,650 |
| Leon |
|
84.5 | 1,372.40 | -2.60 | 23,743 | 23,463 | 27,762 | 1,552 |
| Limestone |
|
96.0 | 362.34 | -0.66 | 195,667 | 195,667 | 203,780 | 12,178 |
| Millers Creek |
|
66.5 | 1,329.23 | -4.77 | 19,085 | 17,802 | 26,768 | 1,534 |
| Mineral Wells |
|
96.8 | 862.63 | -0.37 | 5,102 | 5,102 | 5,273 | 457 |
| Palo Pinto |
|
92.7 | 866.10 | -0.90 | 25,211 | 24,825 | 26,766 | 2,139 |
| Pat Cleburne |
|
94.7 | 732.61 | -0.89 | 24,627 | 24,627 | 26,008 | 1,538 |
| Possum Kingdom |
|
93.8 | 997.10 | -1.90 | 504,928 | 504,928 | 538,139 | 17,038 |
| Proctor |
|
79.6 | 1,159.47 | -2.53 | 43,609 | 43,609 | 54,762 | 4,169 |
| Somerville |
|
100.0 | 239.38 | 1.38 | 166,298 | 150,293 | 150,293 | - n.a. - |
| Stamford |
|
74.7 | 1,414.22 | -2.58 | 38,549 | 38,546 | 51,570 | 4,138 |
| Stillhouse Hollow |
|
100.0 | 622.77 | 0.77 | 234,875 | 229,796 | 229,796 | - n.a. - |
| Sweetwater |
|
19.6 | 2,092.19 | -24.31 | 2,399 | 2,399 | 12,267 | 223 |
| Waco |
|
97.7 | 461.71 | -0.51 | 184,836 | 184,610 | 188,891 | 8,349 |
| White River |
|
24.7 | 2,350.67 | -21.53 | 7,865 | 7,865 | 31,846 | 708 |
| Whitney |
|
99.5 | 532.89 | -0.11 | 563,614 | 562,260 | 564,808 | 23,119 |