Coastal-Bend Planning Region Reservoirs: Monitored Water Supply Reservoirs are 27.3% full on 2026-07-30
Historical Data
| Date | Percent Full |
Reservoir Storage (acre-ft) |
Conservation Storage (acre-ft) |
Conservation Capacity (acre-ft) |
|
|---|---|---|---|---|---|
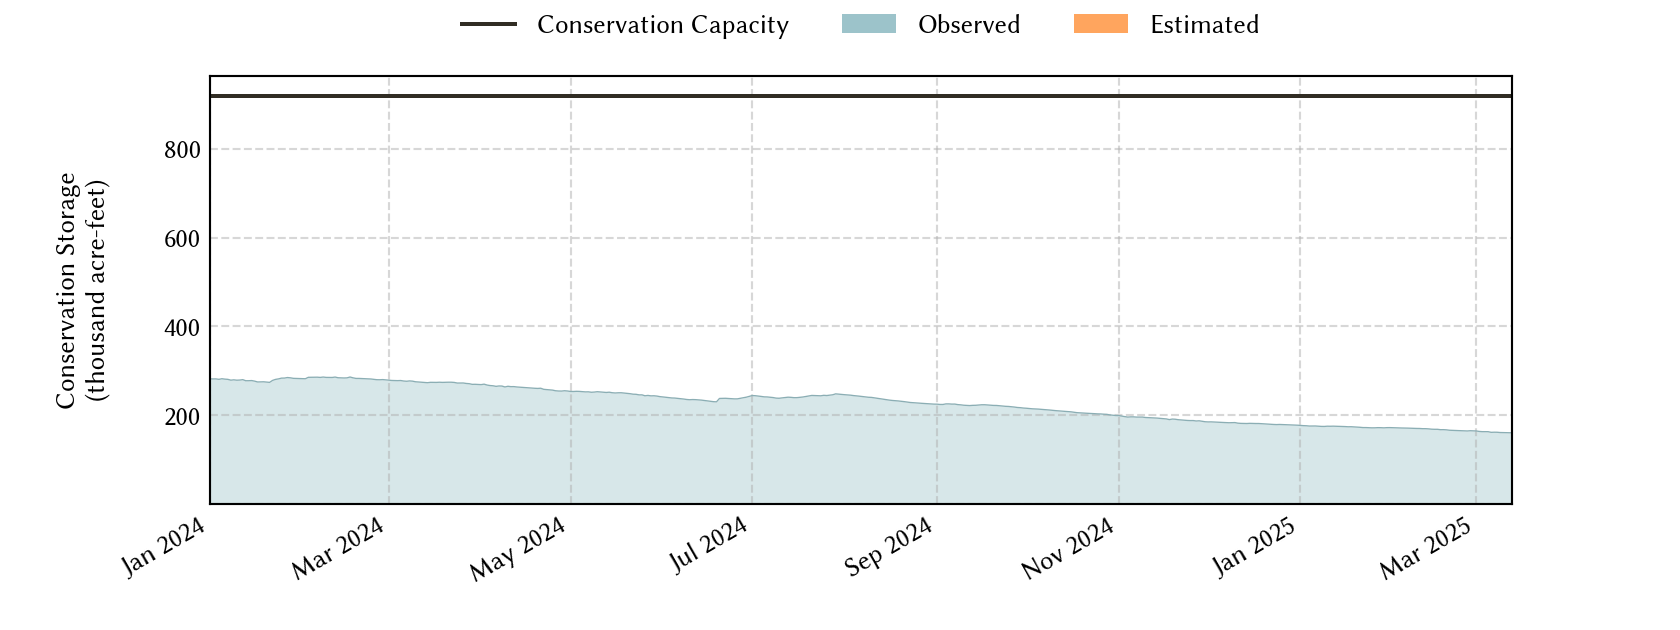
| Today | 2026-07-30 | 27.3 | 251,181 | 250,902 | 918,882 |
| Yesterday | 2026-07-29 | 27.0 | 248,533 | 248,254 | 918,882 |
| 2 days ago | 2026-07-28 | 26.7 | 245,792 | 245,513 | 918,882 |
| 1 week ago | 2026-07-23 | 17.3 | 159,690 | 159,411 | 918,882 |
| 1 month ago | 2026-06-30 | 15.9 | 146,398 | 146,119 | 918,882 |
| 3 months ago | 2026-04-30 | 7.7 | 70,714 | 70,435 | 918,882 |
| 6 months ago | 2026-01-30 | 9.6 | 88,385 | 88,106 | 918,882 |
| 1 year ago | 2025-07-30 | 14.8 | 136,462 | 136,183 | 918,882 |
*
Percent Full is based on Conservation Storage and Conservation Capacity and doesn't account for storage in flood pool.
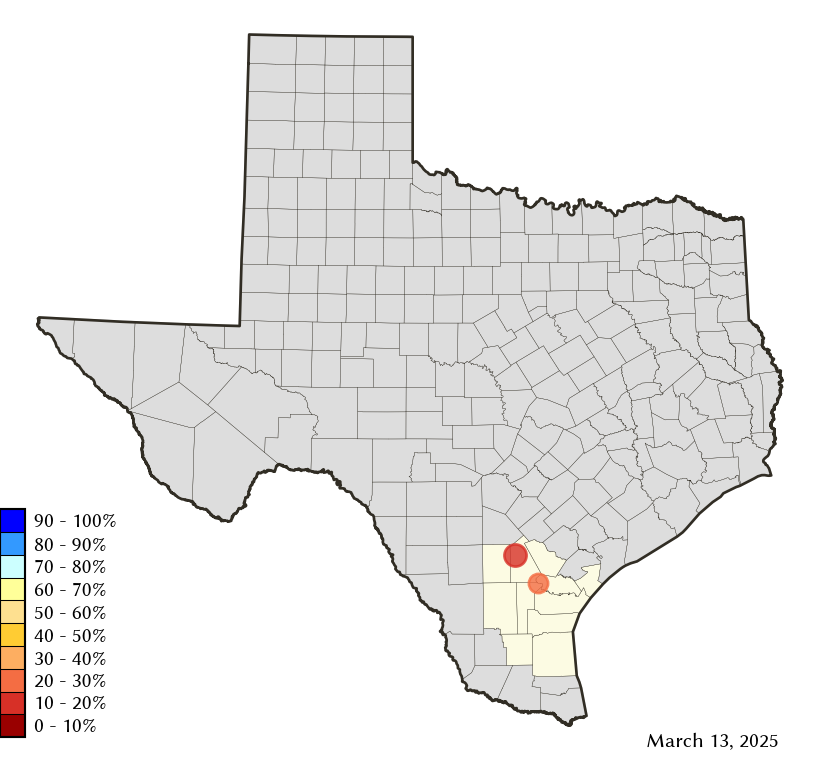
Area Map
Reservoir Storage
| Reservoir | Type | Percent Full |
Water Level (ft) |
Height Above Conservation Pool (ft) |
Reservoir Storage (acre-ft) |
Conservation Storage (acre-ft) |
Conservation Capacity (acre-ft) |
Surface Area (acres) |
|---|---|---|---|---|---|---|---|---|
| Choke Canyon |

|
24.9 | 192.86 | -27.64 | 164,971 | 164,970 | 662,820 | 11,084 |
| Corpus Christi |
|
33.6 | 83.25 | -10.75 | 86,210 | 85,932 | 256,062 | 11,123 |