Lower-Colorado Planning Region Reservoirs: Monitored Water Supply Reservoirs are 99.5% full on 2026-07-30
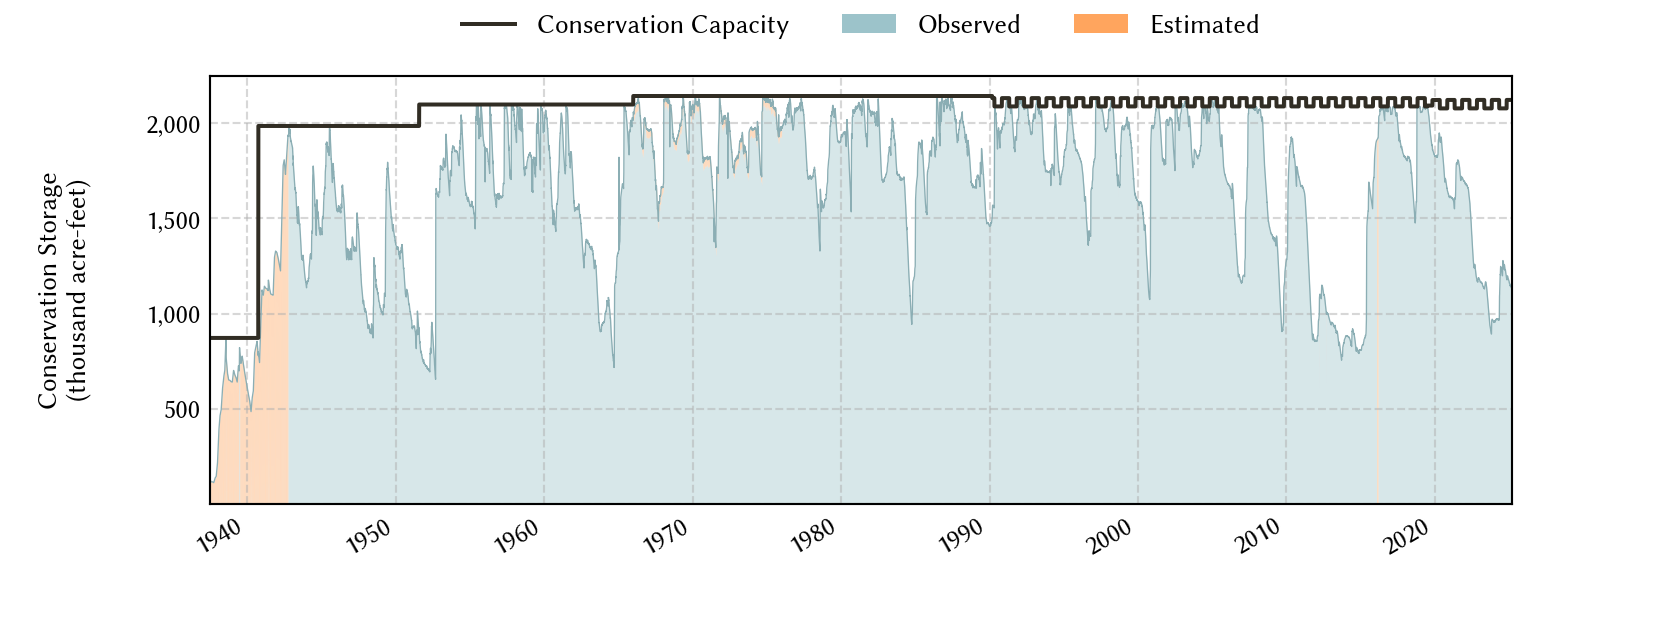
Historical Data
| Date | Percent Full |
Reservoir Storage (acre-ft) |
Conservation Storage (acre-ft) |
Conservation Capacity (acre-ft) |
|
|---|---|---|---|---|---|
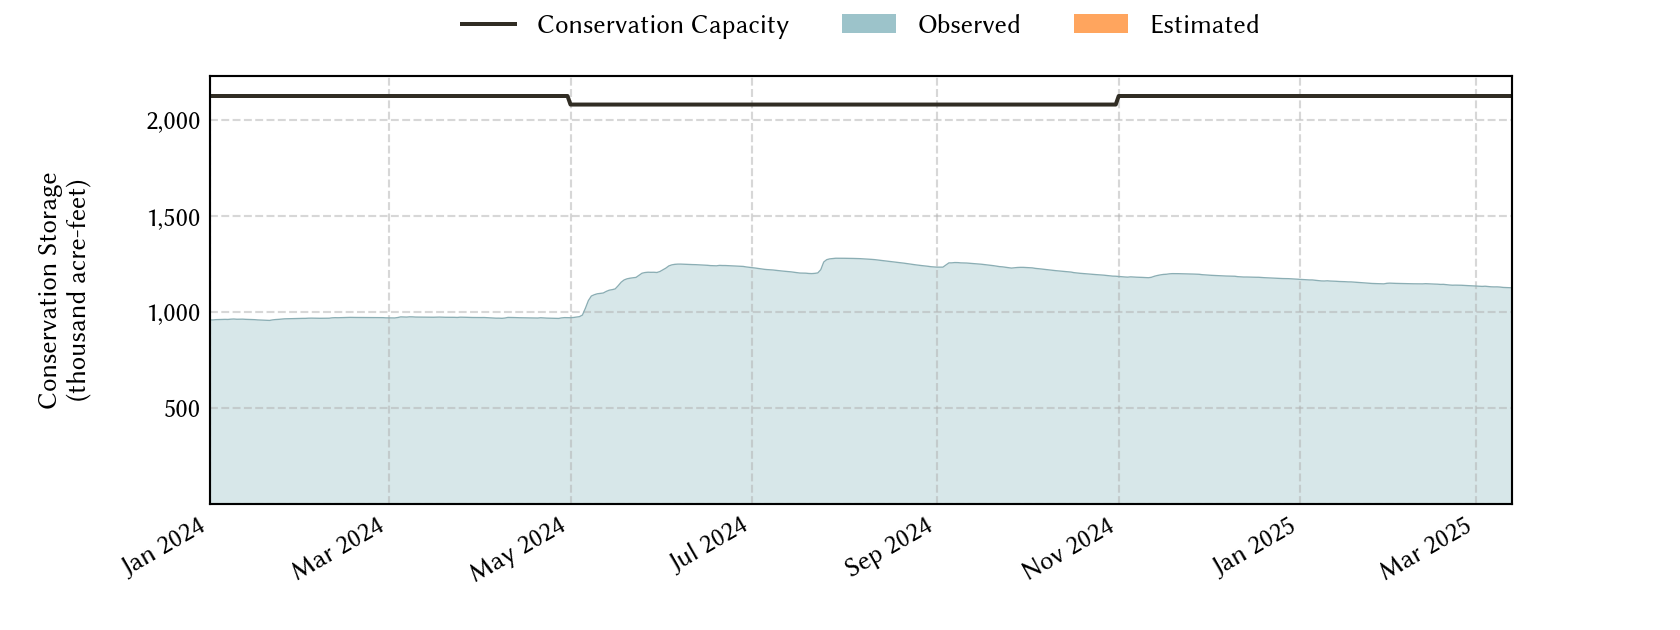
| Today | 2026-07-30 | 99.5 | 2,164,863 | 2,112,531 | 2,122,814 |
| Yesterday | 2026-07-29 | 99.5 | 2,164,797 | 2,113,037 | 2,122,814 |
| 2 days ago | 2026-07-28 | 99.5 | 2,164,481 | 2,113,102 | 2,122,814 |
| 1 week ago | 2026-07-23 | 99.6 | 2,195,148 | 2,113,362 | 2,122,814 |
| 1 month ago | 2026-06-30 | 92.3 | 2,009,673 | 1,959,247 | 2,122,814 |
| 3 months ago | 2026-04-30 | 84.5 | 1,844,713 | 1,794,287 | 2,122,814 |
| 6 months ago | 2026-01-30 | 85.9 | 1,874,252 | 1,823,826 | 2,122,814 |
| 1 year ago | 2025-07-30 | 94.9 | 2,064,345 | 2,013,694 | 2,122,814 |
*
Percent Full is based on Conservation Storage and Conservation Capacity and doesn't account for storage in flood pool.
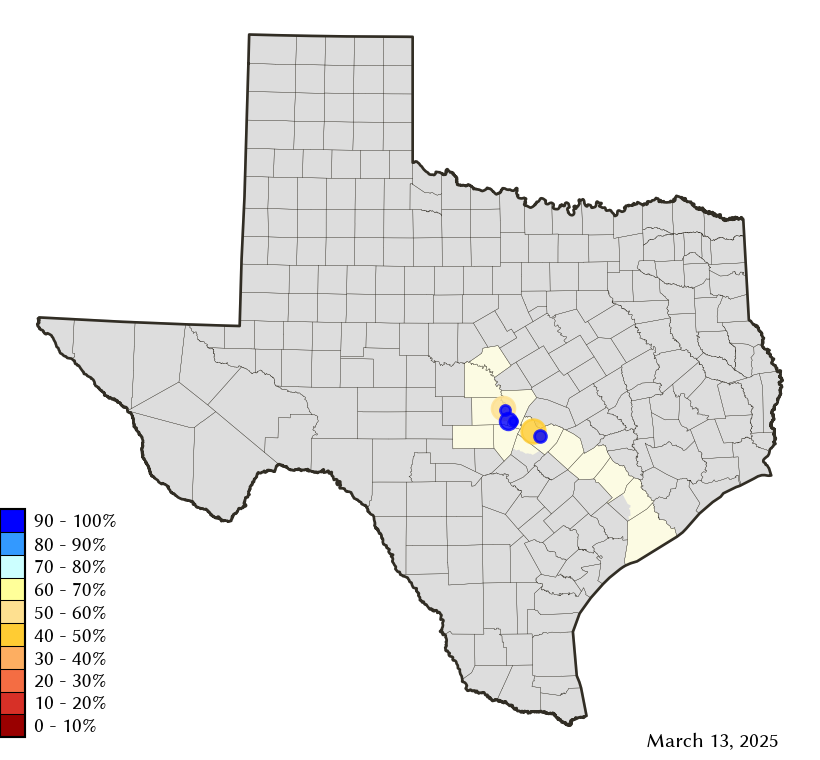
Area Map
Reservoir Storage
| Reservoir | Type | Percent Full |
Water Level (ft) |
Height Above Conservation Pool (ft) |
Reservoir Storage (acre-ft) |
Conservation Storage (acre-ft) |
Conservation Capacity (acre-ft) |
Surface Area (acres) |
|---|---|---|---|---|---|---|---|---|
| Austin |

|
94.8 | 492.00 | -0.80 | 23,335 | 22,726 | 23,972 | 1,534 |
| Buchanan |
|
99.4 | 1,019.77 | -0.23 | 875,199 | 861,537 | 866,694 | 22,398 |
| Inks |
|
95.1 | 887.15 | -0.85 | 13,335 | 13,052 | 13,729 | 789 |
| Lyndon B Johnson |
|
97.5 | 824.56 | -0.44 | 128,797 | 109,957 | 112,778 | 6,391 |
| Marble Falls |
|
95.0 | 736.37 | -0.63 | 7,215 | 7,215 | 7,597 | 601 |
| Travis |

|
100.0 | 681.10 | 0.10 | 1,116,982 | 1,098,044 | 1,098,044 | 19,068 |