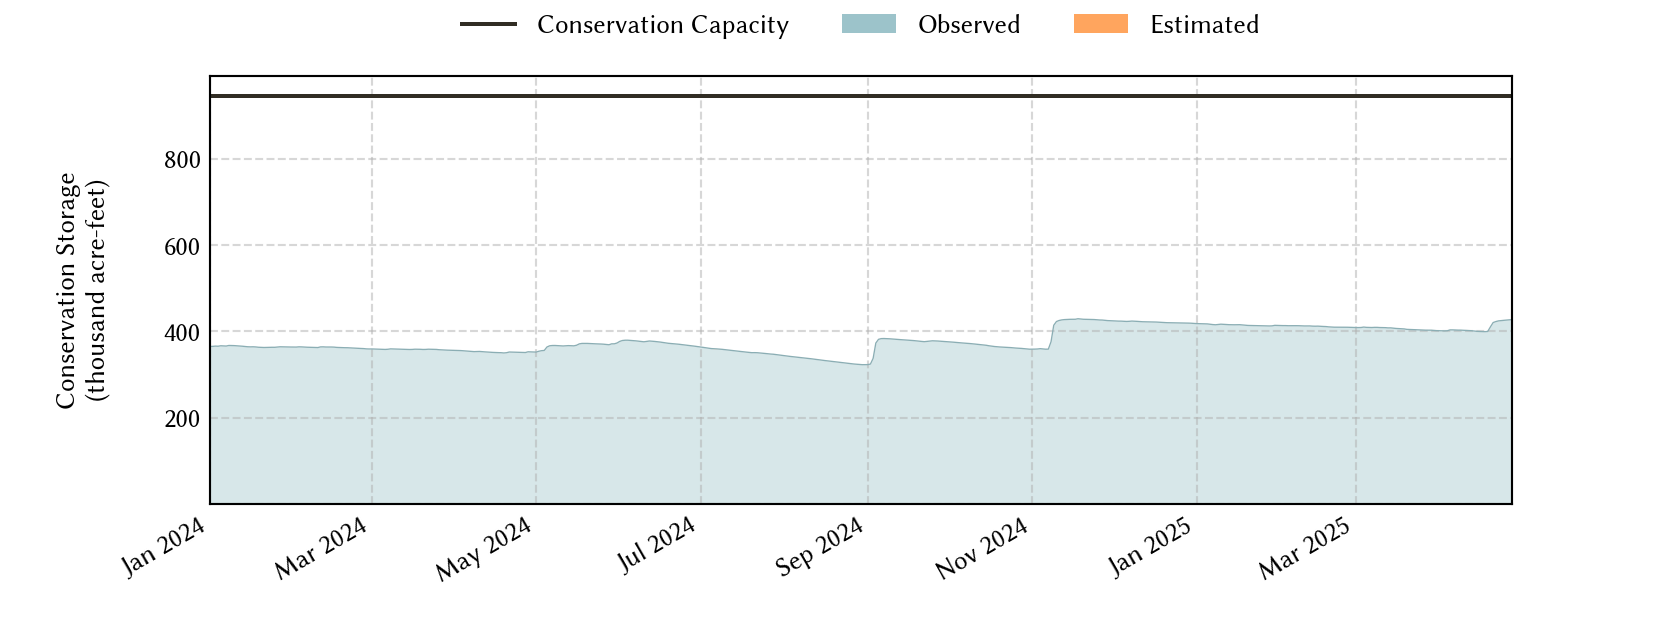
Abilene Area Reservoirs: Monitored Water Supply Reservoirs are 46.3% full on 2026-07-30
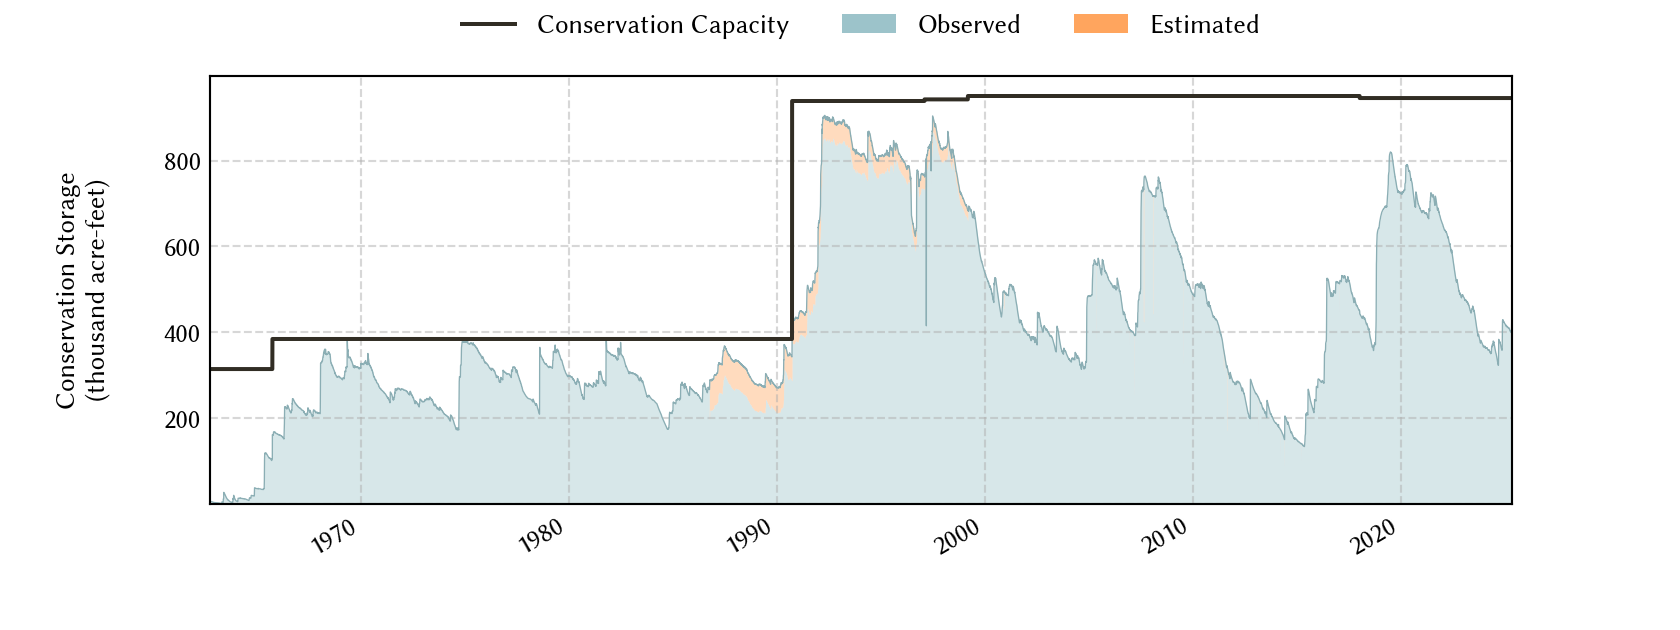

Historical Data
| Date | Percent Full |
Reservoir Storage (acre-ft) |
Conservation Storage (acre-ft) |
Conservation Capacity (acre-ft) |
|
|---|---|---|---|---|---|
| Today | 2026-07-30 | 46.3 | 442,344 | 437,462 | 945,568 |
| Yesterday | 2026-07-29 | 46.3 | 443,041 | 438,159 | 945,568 |
| 2 days ago | 2026-07-28 | 46.4 | 443,740 | 438,858 | 945,568 |
| 1 week ago | 2026-07-23 | 46.9 | 447,971 | 443,089 | 945,568 |
| 1 month ago | 2026-06-30 | 47.7 | 456,356 | 451,474 | 945,568 |
| 3 months ago | 2026-04-30 | 48.0 | 459,133 | 454,251 | 945,568 |
| 6 months ago | 2026-01-30 | 46.8 | 447,712 | 442,830 | 945,568 |
| 1 year ago | 2025-07-30 | 55.2 | 526,483 | 521,601 | 945,568 |
*
Percent Full is based on Conservation Storage and Conservation Capacity and doesn't account for storage in flood pool.
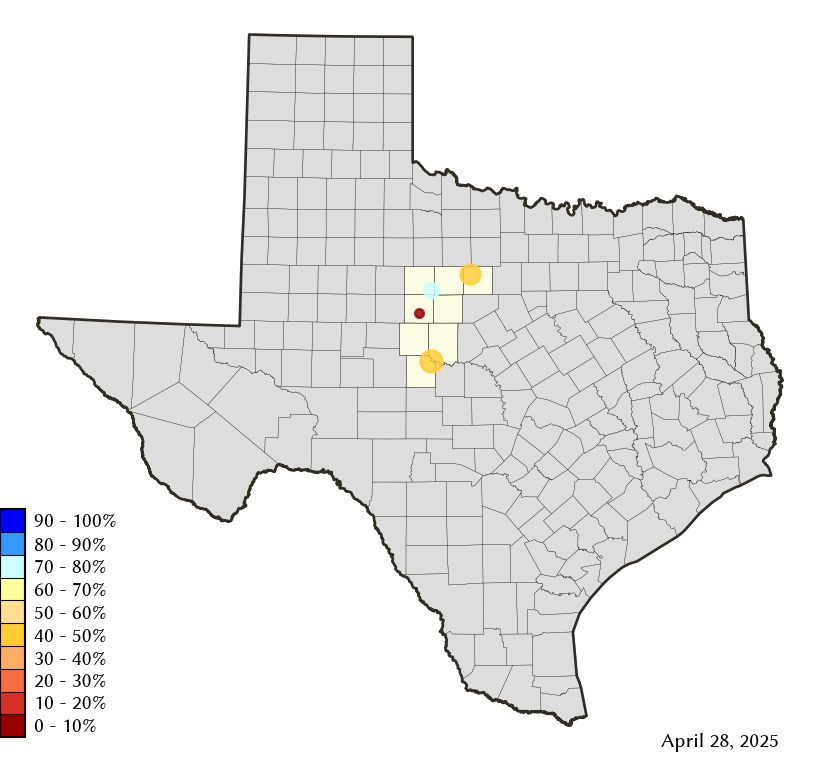
Area Map
Reservoir Storage
| Reservoir | Type | Percent Full |
Water Level (ft) |
Height Above Conservation Pool (ft) |
Reservoir Storage (acre-ft) |
Conservation Storage (acre-ft) |
Conservation Capacity (acre-ft) |
Surface Area (acres) |
|---|---|---|---|---|---|---|---|---|
| Abilene |

|
12.9 | 1,994.24 | -18.06 | 1,020 | 1,020 | 7,900 | 175 |
| Fort Phantom Hill |
|
75.1 | 1,630.98 | -4.92 | 52,623 | 52,617 | 70,030 | 3,178 |
| Hubbard Creek |
|
40.7 | 1,167.86 | -15.45 | 132,373 | 127,497 | 313,298 | 8,634 |
| O H Ivie |
|
46.2 | 1,531.78 | -19.72 | 256,328 | 256,328 | 554,340 | - n.a. - |