Brazos-G Planning Region Reservoirs: Monitored Water Supply Reservoirs are 89.9% full on 2026-07-30
Historical Data
| Date | Percent Full |
Reservoir Storage (acre-ft) |
Conservation Storage (acre-ft) |
Conservation Capacity (acre-ft) |
|
|---|---|---|---|---|---|
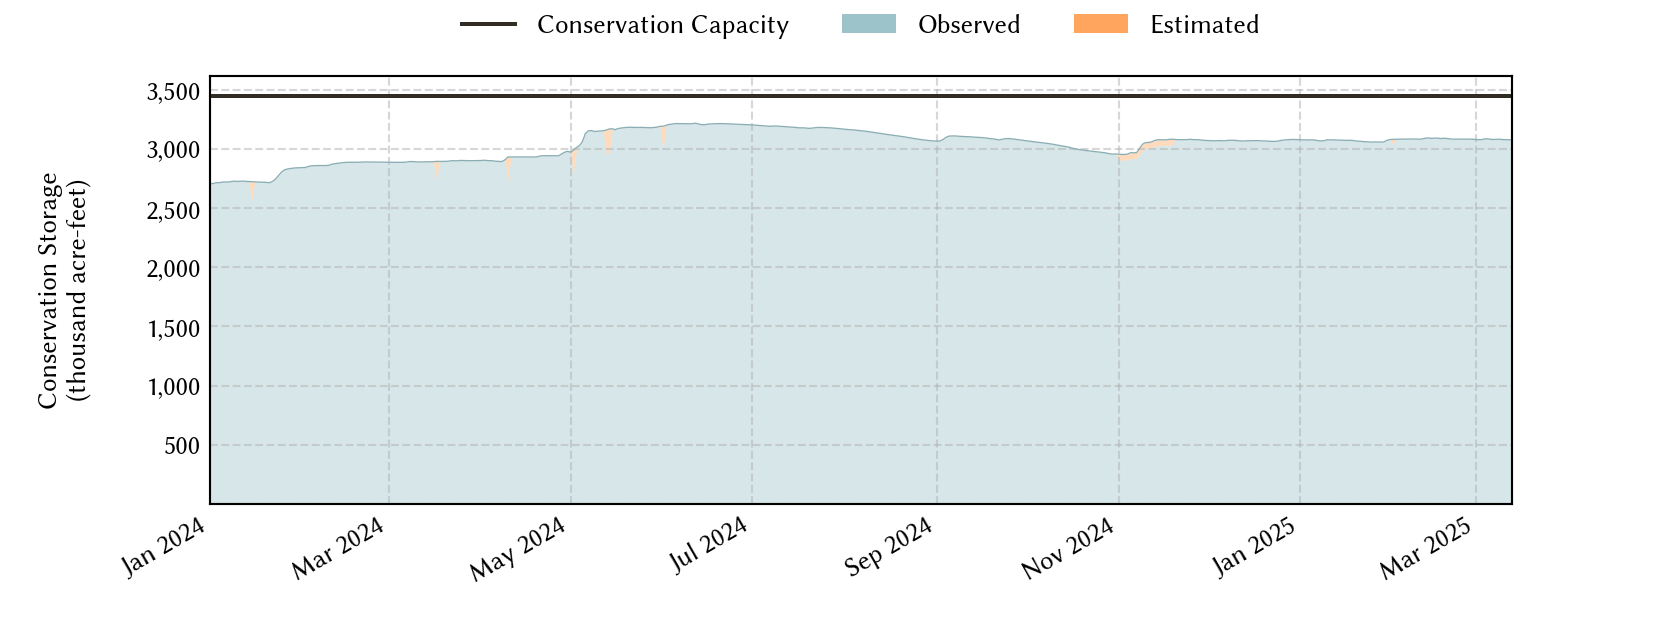
| Today | 2026-07-30 | 89.9 | 3,147,175 | 3,098,663 | 3,448,023 |
| Yesterday | 2026-07-29 | 89.9 | 3,151,884 | 3,101,134 | 3,448,023 |
| 2 days ago | 2026-07-28 | 90.0 | 3,157,645 | 3,104,083 | 3,448,023 |
| 1 week ago | 2026-07-23 | 90.5 | 3,191,902 | 3,119,572 | 3,448,023 |
| 1 month ago | 2026-06-30 | 90.6 | 3,195,554 | 3,125,372 | 3,448,023 |
| 3 months ago | 2026-04-30 | 88.7 | 3,081,516 | 3,057,224 | 3,448,023 |
| 6 months ago | 2026-01-30 | 86.7 | 3,001,160 | 2,989,505 | 3,448,023 |
| 1 year ago | 2025-07-30 | 93.9 | 3,350,894 | 3,237,919 | 3,448,023 |
*
Percent Full is based on Conservation Storage and Conservation Capacity and doesn't account for storage in flood pool.
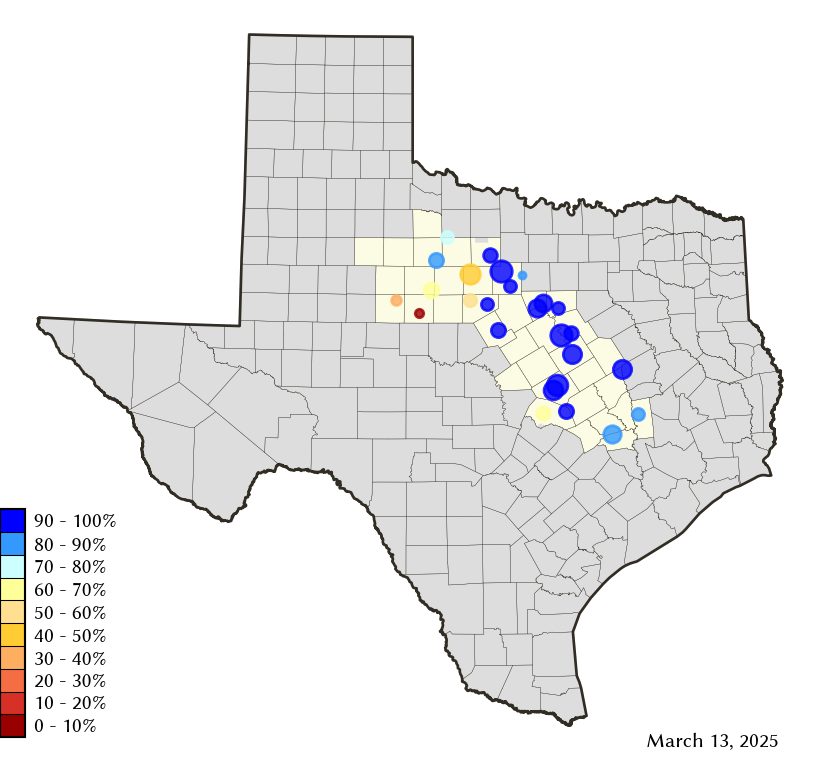
Area Map
Reservoir Storage
| Reservoir | Type | Percent Full |
Water Level (ft) |
Height Above Conservation Pool (ft) |
Reservoir Storage (acre-ft) |
Conservation Storage (acre-ft) |
Conservation Capacity (acre-ft) |
Surface Area (acres) |
|---|---|---|---|---|---|---|---|---|
| Abilene |

|
12.9 | 1,994.24 | -18.06 | 1,020 | 1,020 | 7,900 | 175 |
| Aquilla |

|
99.6 | 537.44 | -0.06 | 43,094 | 43,058 | 43,243 | 3,078 |
| Belton |
|
100.0 | 594.80 | 0.80 | 442,671 | 432,631 | 432,631 | - n.a. - |
| Cisco |
|
45.2 | 1,504.38 | -18.08 | 13,120 | 13,120 | 29,003 | 610 |
| Comanche Creek |
|
100.0 | 775.34 | 0.34 | 152,352 | 151,250 | 151,250 | - n.a. - |
| Fort Phantom Hill |
|
75.1 | 1,630.98 | -4.92 | 52,623 | 52,617 | 70,030 | 3,178 |
| Georgetown |
|
100.0 | 791.60 | 0.60 | 38,858 | 38,005 | 38,005 | - n.a. - |
| Gibbons Creek |
|
96.4 | 246.63 | -0.37 | 26,488 | 24,784 | 25,721 | 2,513 |
| Graham |
|
73.4 | 1,069.74 | -5.26 | 33,276 | 33,262 | 45,288 | 2,064 |
| Granbury |
|
93.3 | 691.58 | -1.12 | 124,934 | 124,025 | 132,949 | 7,764 |
| Granger |
|
100.0 | 505.49 | 1.49 | 58,183 | 51,822 | 51,822 | - n.a. - |
| Hubbard Creek |
|
40.7 | 1,167.86 | -15.45 | 132,373 | 127,497 | 313,298 | 8,634 |
| Leon |
|
84.6 | 1,372.42 | -2.58 | 23,774 | 23,494 | 27,762 | 1,553 |
| Limestone |
|
95.8 | 362.31 | -0.69 | 195,302 | 195,302 | 203,780 | 12,168 |
| Millers Creek |
|
66.3 | 1,329.20 | -4.80 | 19,039 | 17,756 | 26,768 | 1,531 |
| Mineral Wells |
|
96.6 | 862.61 | -0.39 | 5,093 | 5,093 | 5,273 | 457 |
| Palo Pinto |
|
92.2 | 866.03 | -0.97 | 25,061 | 24,675 | 26,766 | 2,136 |
| Pat Cleburne |
|
94.5 | 732.58 | -0.92 | 24,581 | 24,581 | 26,008 | 1,537 |
| Possum Kingdom |
|
93.7 | 997.06 | -1.94 | 504,248 | 504,248 | 538,139 | 17,019 |
| Proctor |
|
79.3 | 1,159.43 | -2.57 | 43,442 | 43,442 | 54,762 | 4,152 |
| Somerville |
|
100.0 | 239.25 | 1.25 | 164,751 | 150,293 | 150,293 | - n.a. - |
| Stamford |
|
74.5 | 1,414.19 | -2.61 | 38,426 | 38,423 | 51,570 | 4,128 |
| Stillhouse Hollow |
|
100.0 | 622.70 | 0.70 | 234,417 | 229,796 | 229,796 | - n.a. - |
| Sweetwater |
|
19.5 | 2,092.17 | -24.33 | 2,395 | 2,395 | 12,267 | 223 |
| Waco |
|
97.6 | 461.67 | -0.55 | 184,502 | 184,276 | 188,891 | 8,342 |
| Whitney |
|
99.5 | 532.87 | -0.13 | 563,152 | 561,798 | 564,808 | 23,100 |