South-Central Climate Division Reservoirs: Monitored Water Supply Reservoirs are 90.3% full on 2026-07-30
Historical Data
| Date | Percent Full |
Reservoir Storage (acre-ft) |
Conservation Storage (acre-ft) |
Conservation Capacity (acre-ft) |
|
|---|---|---|---|---|---|
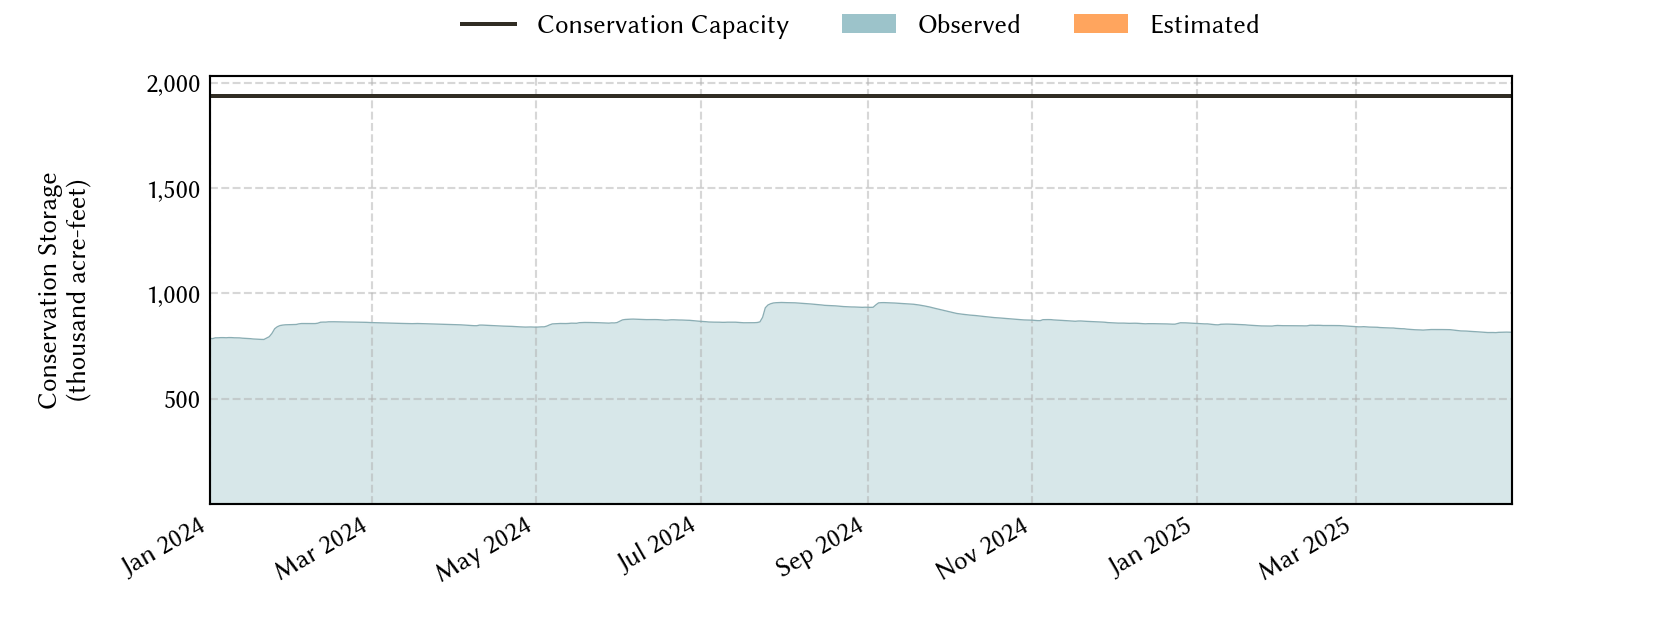
| Today | 2026-07-30 | 90.3 | 1,792,718 | 1,749,846 | 1,936,953 |
| Yesterday | 2026-07-29 | 90.3 | 1,792,744 | 1,749,625 | 1,936,953 |
| 2 days ago | 2026-07-28 | 90.3 | 1,793,307 | 1,749,756 | 1,936,953 |
| 1 week ago | 2026-07-23 | 90.3 | 1,824,686 | 1,748,434 | 1,936,953 |
| 1 month ago | 2026-06-30 | 72.0 | 1,428,586 | 1,394,152 | 1,936,953 |
| 3 months ago | 2026-04-30 | 62.2 | 1,221,592 | 1,203,880 | 1,936,953 |
| 6 months ago | 2026-01-30 | 65.5 | 1,286,361 | 1,268,649 | 1,936,953 |
| 1 year ago | 2025-07-30 | 76.0 | 1,492,437 | 1,472,465 | 1,936,953 |
*
Percent Full is based on Conservation Storage and Conservation Capacity and doesn't account for storage in flood pool.
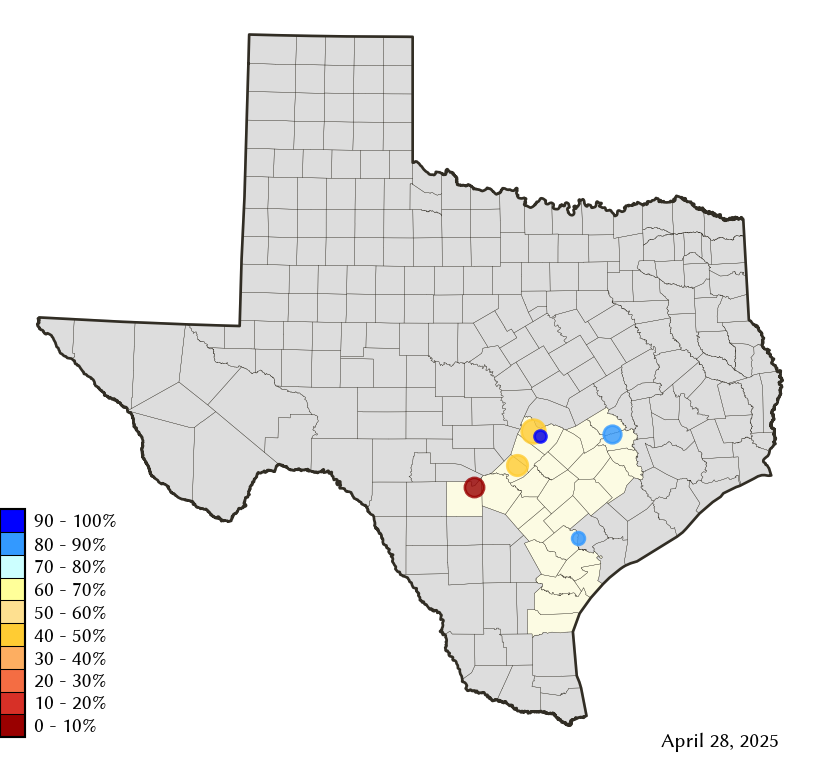
Area Map
Reservoir Storage
| Reservoir | Type | Percent Full |
Water Level (ft) |
Height Above Conservation Pool (ft) |
Reservoir Storage (acre-ft) |
Conservation Storage (acre-ft) |
Conservation Capacity (acre-ft) |
Surface Area (acres) |
|---|---|---|---|---|---|---|---|---|
| Austin |

|
94.8 | 492.00 | -0.80 | 23,335 | 22,726 | 23,972 | 1,534 |
| Canyon |

|
100.0 | 910.06 | 1.06 | 387,648 | 378,781 | 378,781 | - n.a. - |
| Coleto Creek |
|
81.1 | 95.53 | -2.47 | 25,173 | 25,173 | 31,040 | 2,304 |
| Medina |
|
29.4 | 1,021.37 | -42.83 | 74,829 | 74,829 | 254,823 | 2,502 |
| Somerville |
|
100.0 | 239.25 | 1.25 | 164,751 | 150,293 | 150,293 | - n.a. - |
| Travis |
|
100.0 | 681.10 | 0.10 | 1,116,982 | 1,098,044 | 1,098,044 | 19,068 |