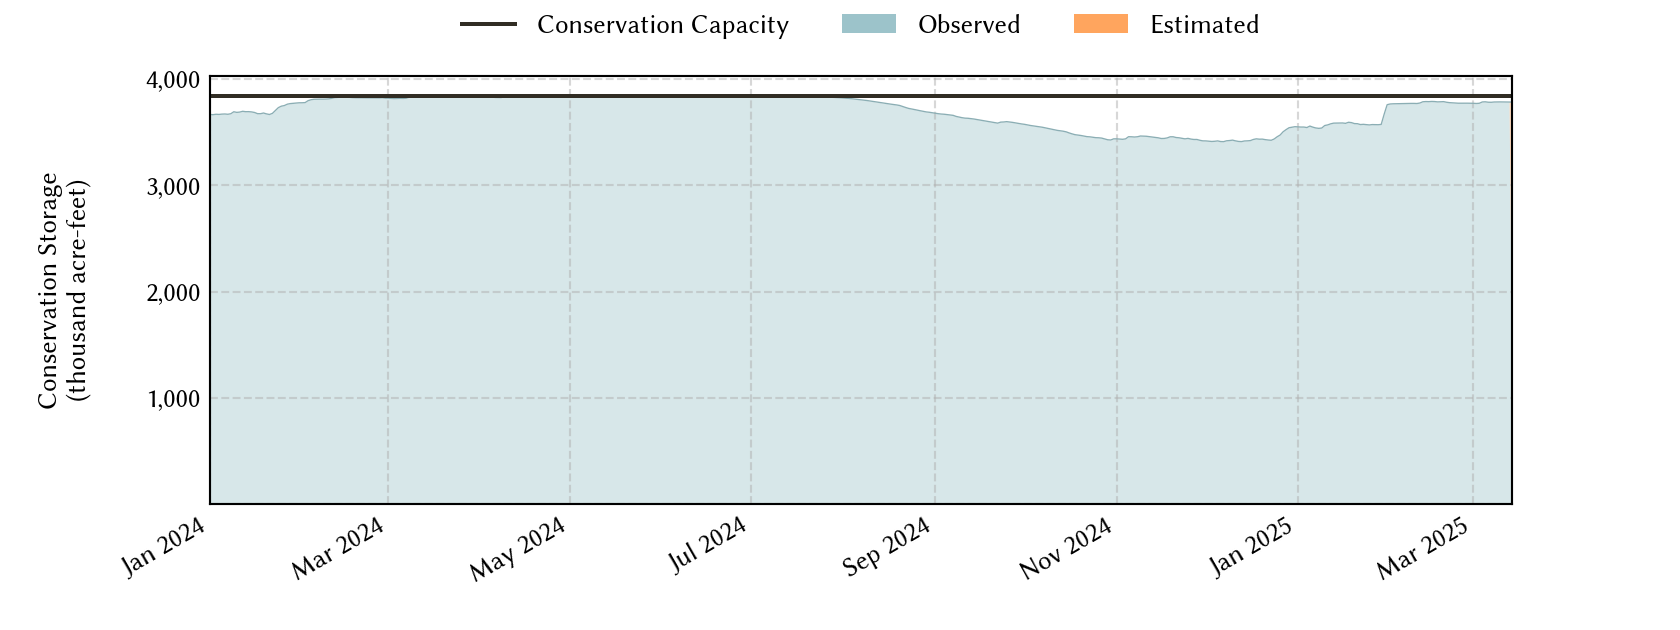
Dallas Area Reservoirs: Monitored Water Supply Reservoirs are 96.5% full on 2026-07-30
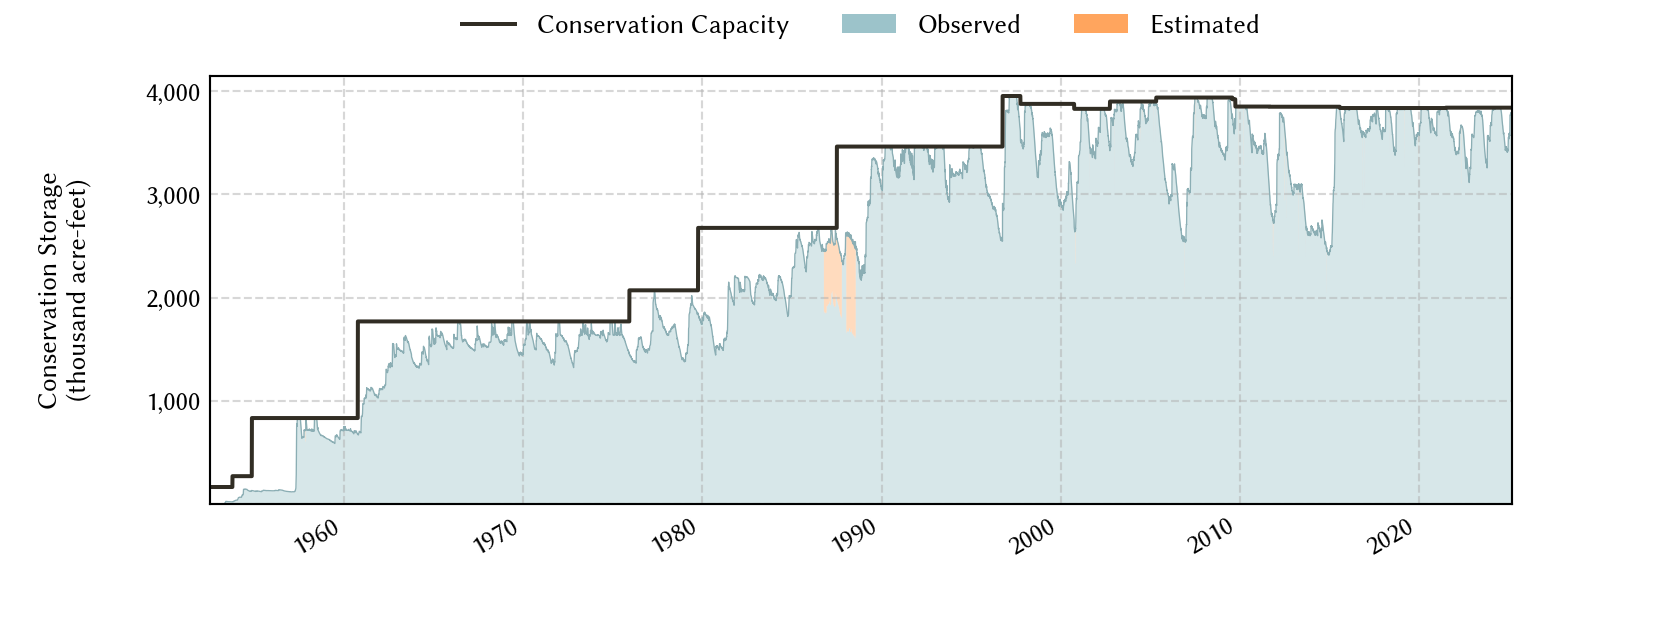
Historical Data
| Date | Percent Full |
Reservoir Storage (acre-ft) |
Conservation Storage (acre-ft) |
Conservation Capacity (acre-ft) |
|
|---|---|---|---|---|---|
| Today | 2026-07-30 | 96.5 | 3,777,812 | 3,707,523 | 3,841,548 |
| Yesterday | 2026-07-29 | 96.6 | 3,782,178 | 3,711,889 | 3,841,548 |
| 2 days ago | 2026-07-28 | 96.8 | 3,787,709 | 3,717,420 | 3,841,548 |
| 1 week ago | 2026-07-23 | 97.6 | 3,821,918 | 3,749,188 | 3,841,548 |
| 1 month ago | 2026-06-30 | 98.6 | 3,940,124 | 3,788,459 | 3,841,548 |
| 3 months ago | 2026-04-30 | 98.1 | 3,865,574 | 3,768,801 | 3,841,548 |
| 6 months ago | 2026-01-30 | 93.0 | 3,641,387 | 3,571,098 | 3,841,548 |
| 1 year ago | 2025-07-30 | 98.7 | 3,863,823 | 3,792,418 | 3,841,548 |
*
Percent Full is based on Conservation Storage and Conservation Capacity and doesn't account for storage in flood pool.
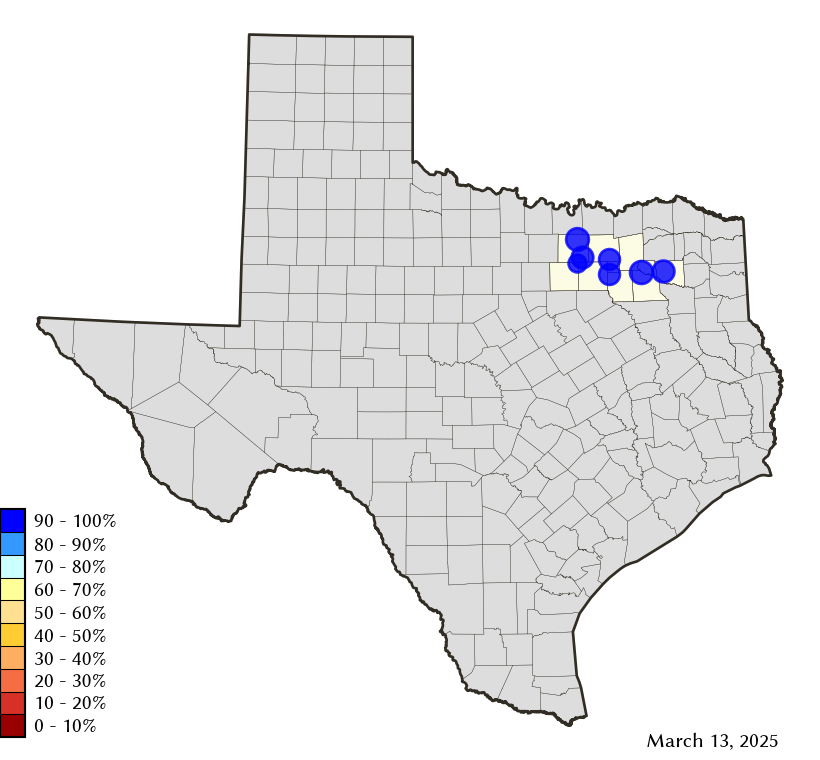
Area Map
Reservoir Storage
| Reservoir | Type | Percent Full |
Water Level (ft) |
Height Above Conservation Pool (ft) |
Reservoir Storage (acre-ft) |
Conservation Storage (acre-ft) |
Conservation Capacity (acre-ft) |
Surface Area (acres) |
|---|---|---|---|---|---|---|---|---|
| Fork |

|
88.1 | 400.18 | -2.82 | 565,316 | 533,873 | 606,088 | 24,327 |
| Grapevine |

|
99.7 | 534.92 | -0.08 | 162,537 | 162,537 | 163,064 | 6,601 |
| Lavon |
|
96.5 | 491.29 | -0.71 | 398,070 | 395,229 | 409,757 | 20,315 |
| Lewisville |
|
97.7 | 521.51 | -0.49 | 585,750 | 550,076 | 563,228 | 26,661 |
| Ray Hubbard |
|
96.4 | 434.73 | -0.77 | 423,730 | 423,730 | 439,559 | 20,291 |
| Ray Roberts |
|
99.4 | 632.34 | -0.16 | 783,960 | 783,637 | 788,167 | 28,261 |
| Tawakoni |
|
98.5 | 437.14 | -0.36 | 858,449 | 858,441 | 871,685 | 36,576 |