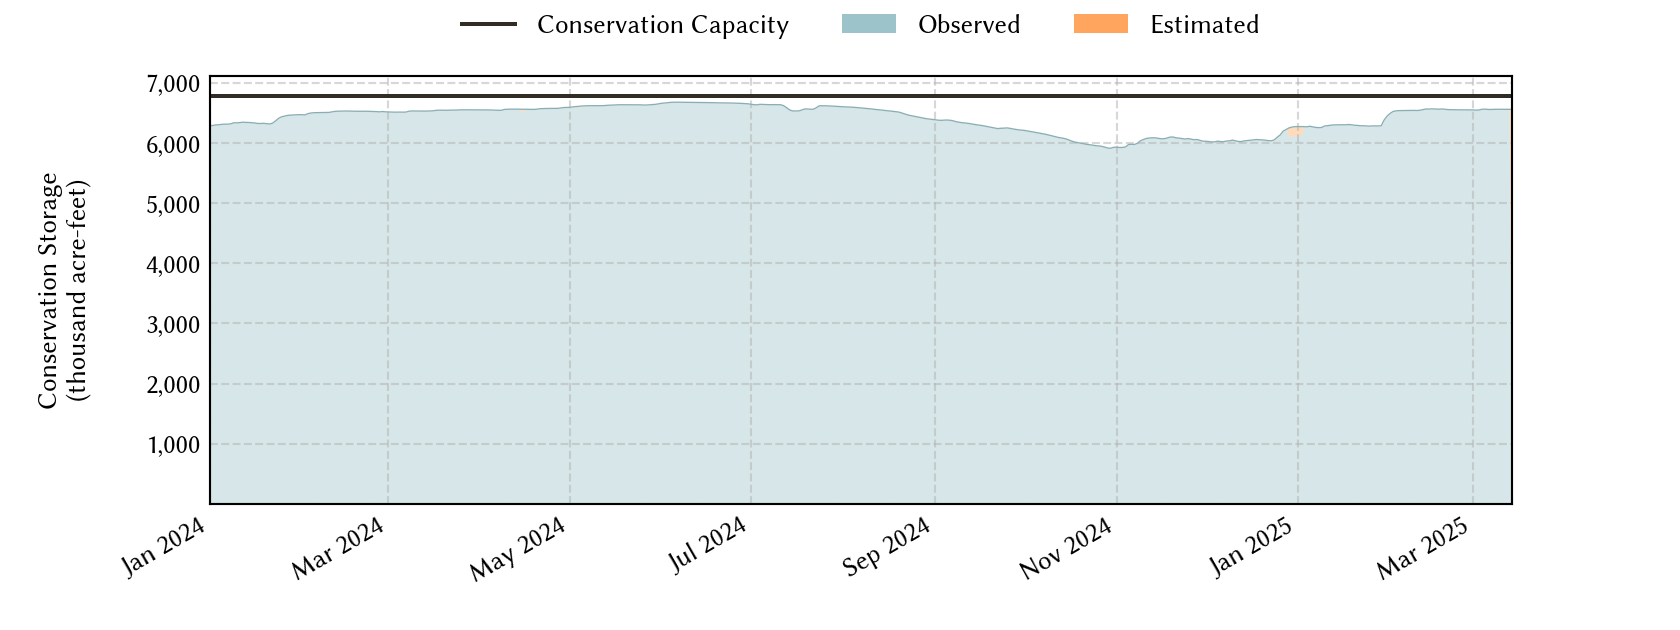
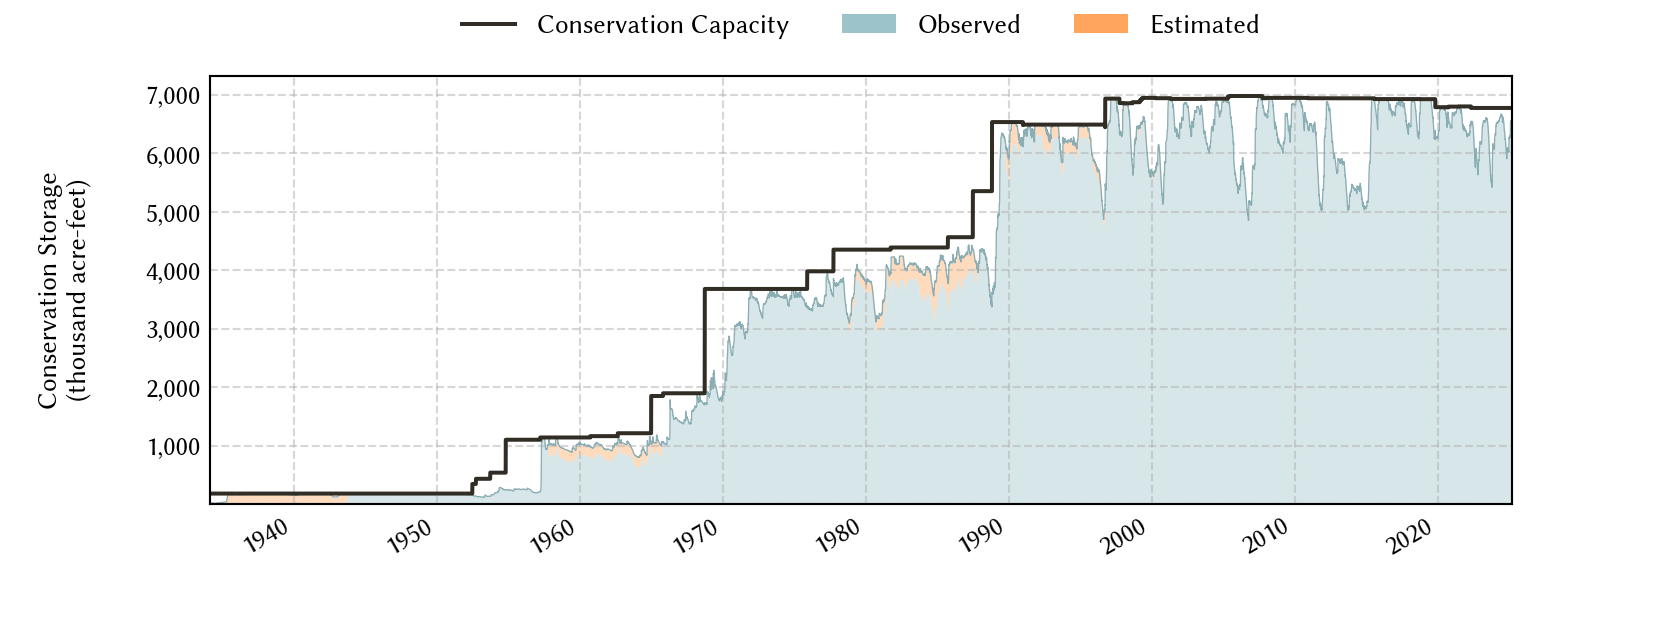
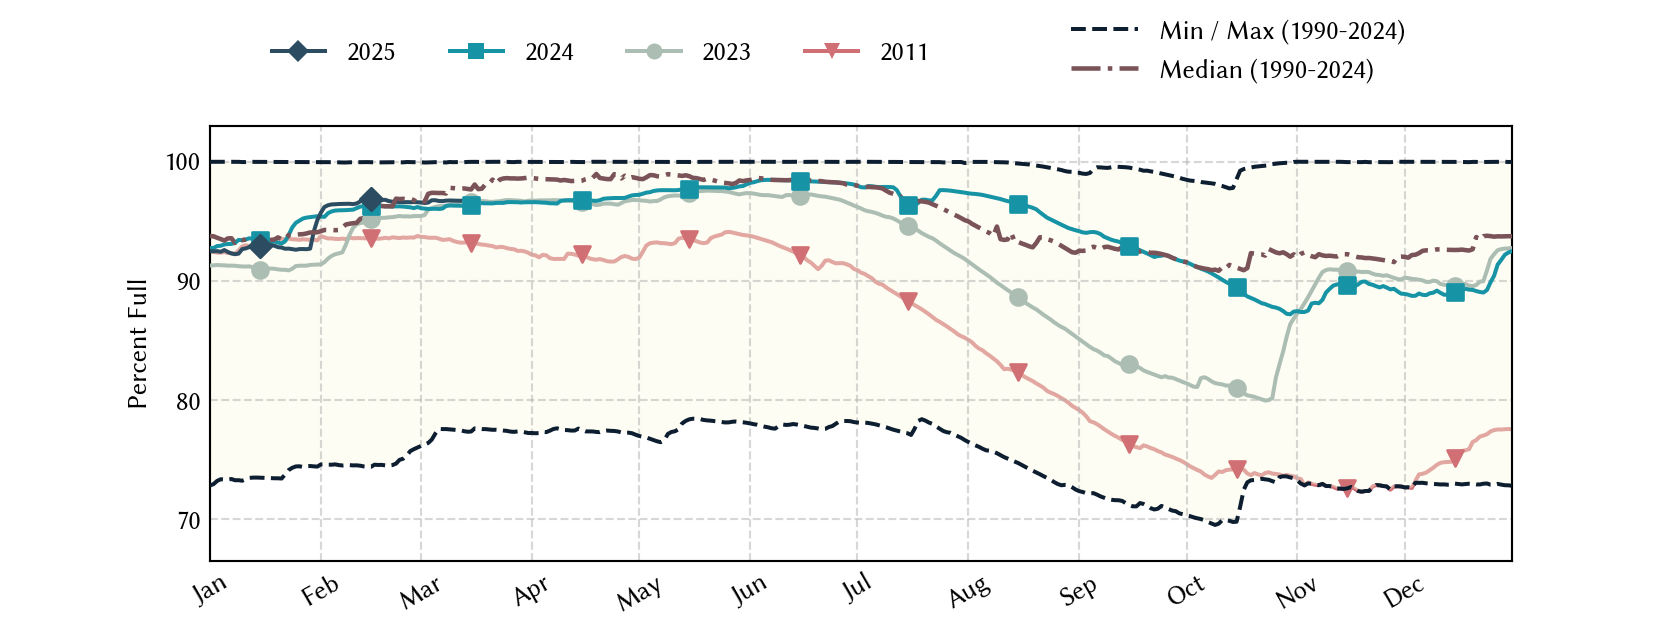
Trinity River Basin Reservoirs: Monitored Water Supply Reservoirs are 94.8% full on 2026-07-30
Historical Data
| Date | Percent Full |
Reservoir Storage (acre-ft) |
Conservation Storage (acre-ft) |
Conservation Capacity (acre-ft) |
|
|---|---|---|---|---|---|
| Today | 2026-07-30 | 94.8 | 6,500,601 | 6,422,210 | 6,776,855 |
| Yesterday | 2026-07-29 | 94.9 | 6,507,447 | 6,429,027 | 6,776,855 |
| 2 days ago | 2026-07-28 | 95.0 | 6,517,967 | 6,439,519 | 6,776,855 |
| 1 week ago | 2026-07-23 | 95.8 | 6,579,389 | 6,494,427 | 6,776,855 |
| 1 month ago | 2026-06-30 | 96.6 | 6,714,319 | 6,547,545 | 6,776,855 |
| 3 months ago | 2026-04-30 | 96.0 | 6,640,604 | 6,504,792 | 6,776,855 |
| 6 months ago | 2026-01-30 | 93.3 | 6,412,450 | 6,325,391 | 6,776,855 |
| 1 year ago | 2025-07-30 | 98.5 | 6,759,523 | 6,677,142 | 6,776,855 |
*
Percent Full is based on Conservation Storage and Conservation Capacity and doesn't account for storage in flood pool.
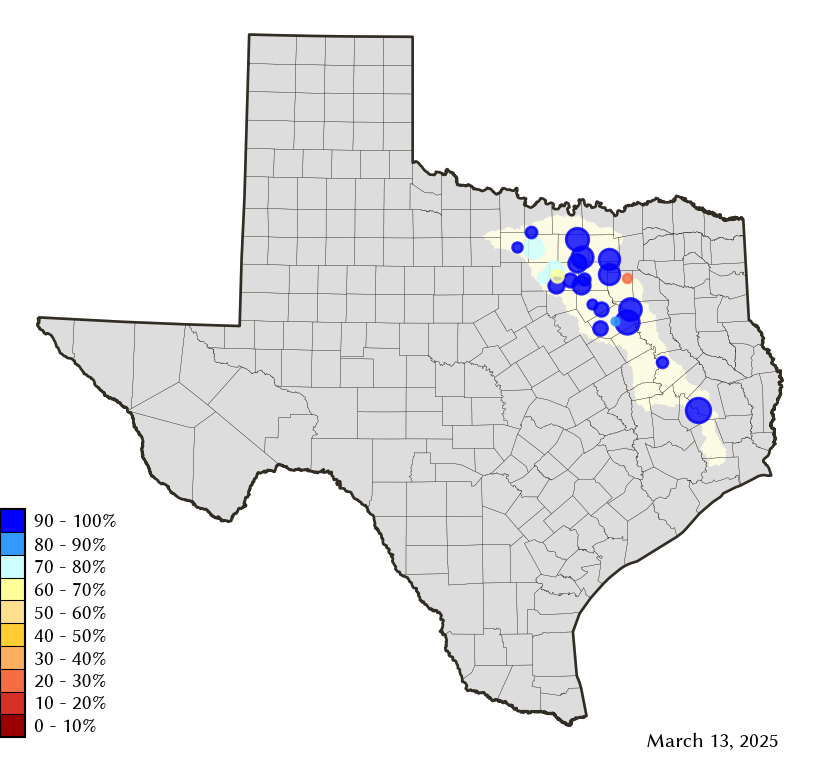
Area Map
Reservoir Storage
| Reservoir | Type | Percent Full |
Water Level (ft) |
Height Above Conservation Pool (ft) |
Reservoir Storage (acre-ft) |
Conservation Storage (acre-ft) |
Conservation Capacity (acre-ft) |
Surface Area (acres) |
|---|---|---|---|---|---|---|---|---|
| Amon G Carter |

|
84.2 | 917.83 | -2.17 | 17,012 | 16,228 | 19,266 | 1,327 |
| Arlington |
|
84.4 | 546.67 | -3.33 | 33,914 | 33,882 | 40,157 | 1,851 |
| Bardwell |

|
98.2 | 420.76 | -0.24 | 43,131 | 43,070 | 43,856 | 3,261 |
| Benbrook |
|
92.9 | 692.29 | -1.71 | 79,535 | 79,535 | 85,648 | 3,490 |
| Bridgeport |
|
84.0 | 830.91 | -5.09 | 312,645 | 312,645 | 372,183 | 11,150 |
| Cedar Creek |
|
82.0 | 318.23 | -3.77 | 528,502 | 528,403 | 644,686 | 29,161 |
| Eagle Mountain |
|
84.8 | 645.87 | -3.23 | 156,874 | 156,874 | 185,087 | 8,284 |
| Grapevine |
|
99.7 | 534.92 | -0.08 | 162,537 | 162,537 | 163,064 | 6,601 |
| Halbert |
|
81.7 | 366.01 | -1.99 | 4,929 | 4,929 | 6,033 | 532 |
| Houston County |
|
98.9 | 259.86 | -0.14 | 17,485 | 16,933 | 17,113 | 1,286 |
| Joe Pool |
|
98.2 | 521.59 | -0.41 | 148,279 | 146,909 | 149,629 | 6,586 |
| Lavon |
|
96.5 | 491.29 | -0.71 | 398,070 | 395,229 | 409,757 | 20,315 |
| Lewisville |
|
97.7 | 521.51 | -0.49 | 585,750 | 550,076 | 563,228 | 26,661 |
| Livingston |
|
99.2 | 130.84 | -0.16 | 1,591,117 | 1,591,117 | 1,603,504 | 77,119 |
| Lost Creek |
|
92.6 | 1,007.25 | -2.25 | 11,070 | 11,070 | 11,950 | - n.a. - |
| Mountain Creek |
|
100.0 | 457.48 | 0.48 | 24,052 | 22,850 | 22,850 | 2,815 |
| Navarro Mills |
|
92.9 | 423.74 | -0.76 | 46,309 | 46,308 | 49,827 | 4,556 |
| New Terrell City |
|
29.8 | 494.66 | -9.34 | 2,565 | 2,554 | 8,583 | 402 |
| Ray Hubbard |
|
96.4 | 434.73 | -0.77 | 423,730 | 423,730 | 439,559 | 20,291 |
| Ray Roberts |
|
99.4 | 632.34 | -0.16 | 783,960 | 783,637 | 788,167 | 28,261 |
| Richland-Chambers |
|
95.8 | 313.94 | -1.06 | 1,079,143 | 1,053,360 | 1,099,417 | 43,027 |
| Waxahachie |
|
94.0 | 530.47 | -1.03 | 10,975 | 10,393 | 11,060 | 640 |
| Weatherford |
|
62.7 | 889.24 | -6.76 | 11,177 | 11,177 | 17,812 | 894 |
| Worth |
|
76.8 | 592.30 | -1.70 | 27,840 | 18,764 | 24,419 | 3,224 |