Lake Arlington: 84.4% full as of 2026-07-30
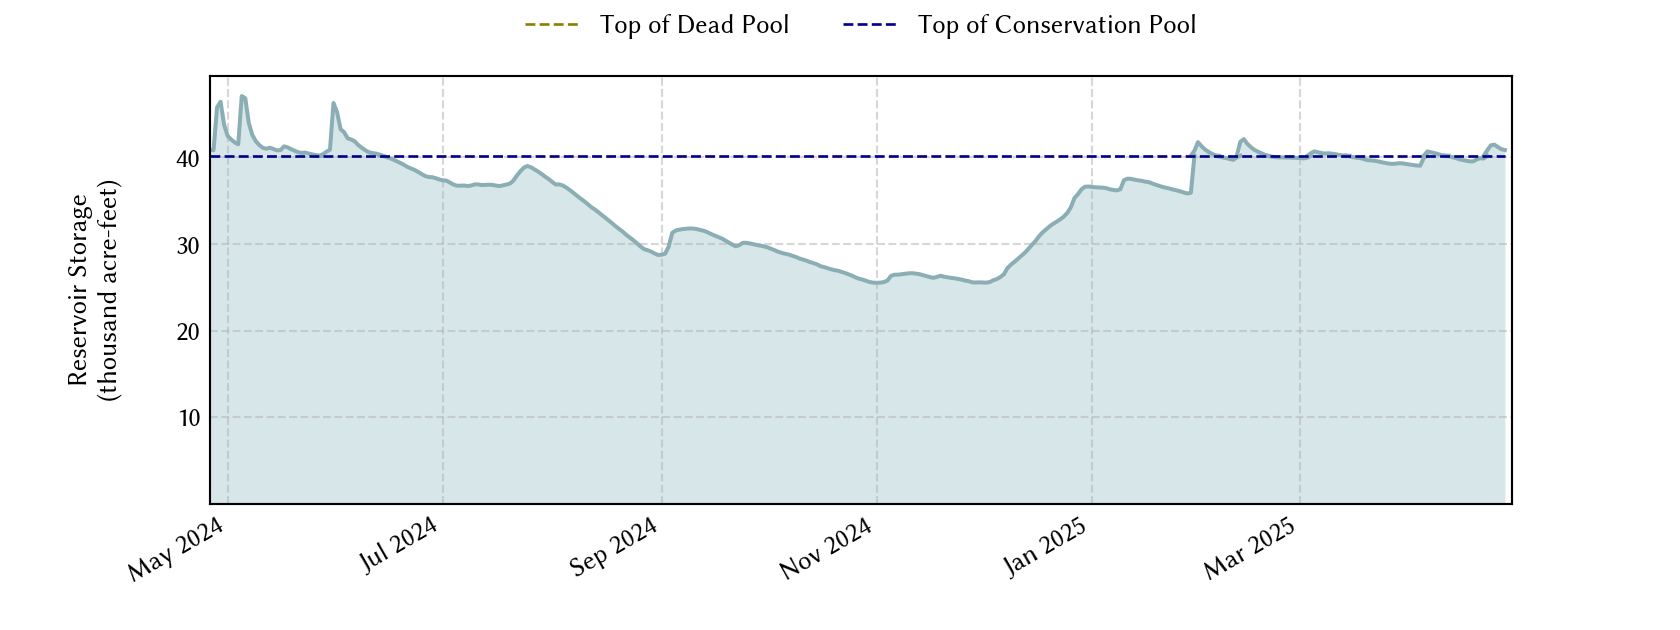
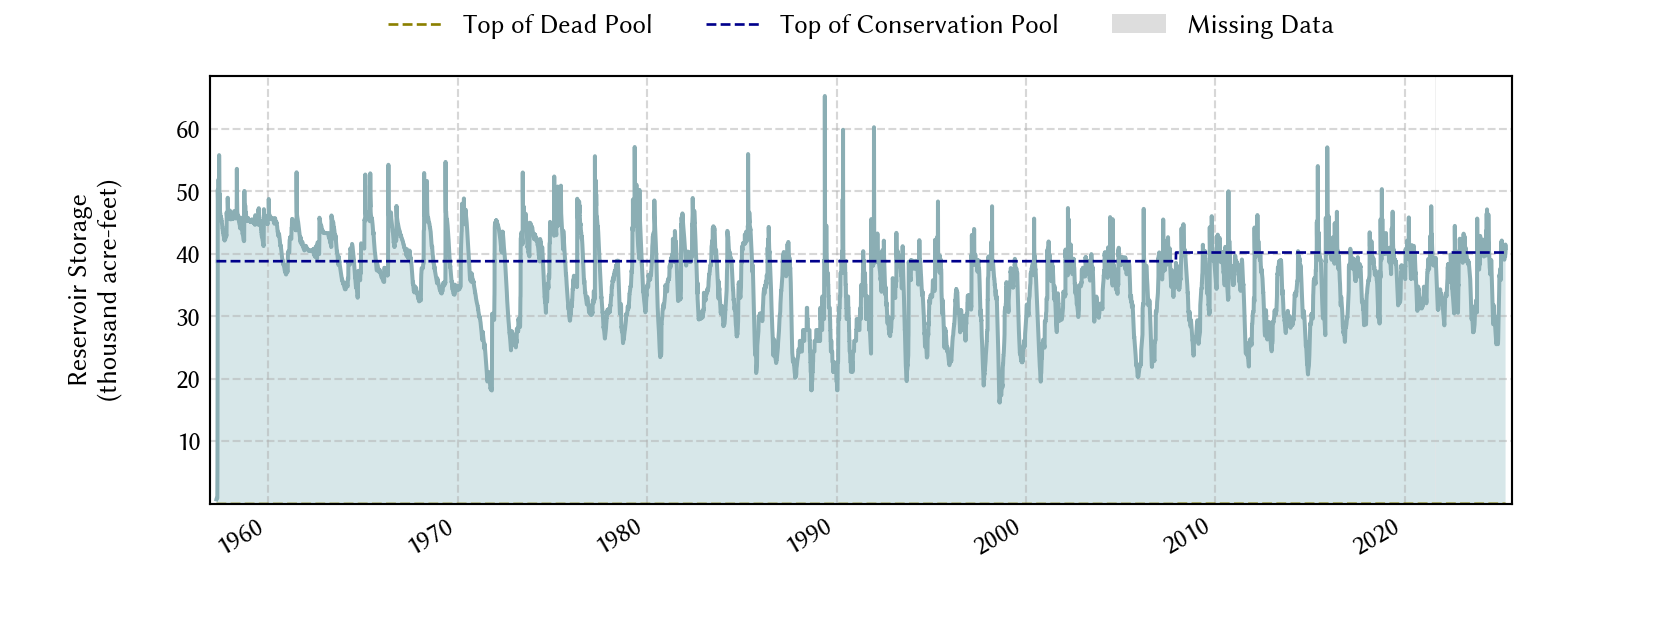
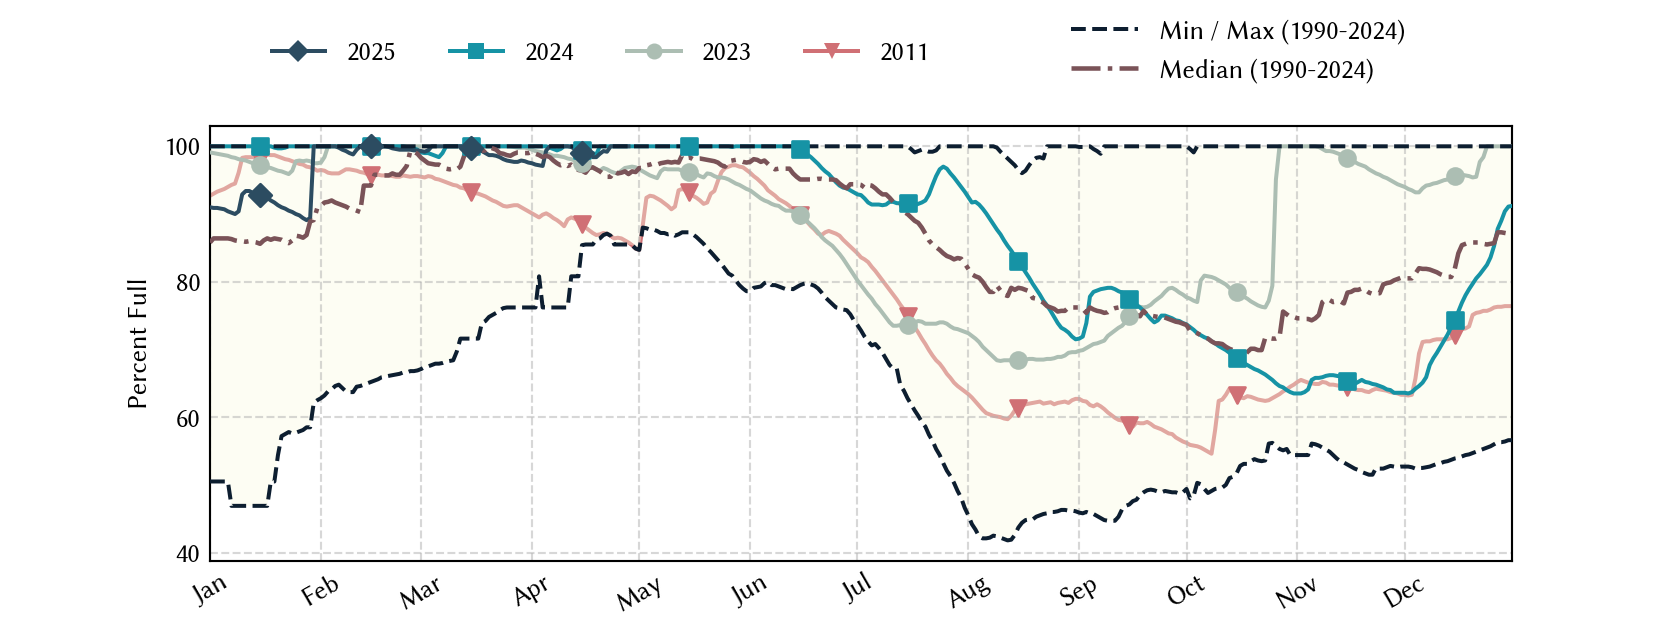
Historical Data
| Date | Percent Full |
Mean Water Level (ft) |
Reservoir Storage (acre-ft) |
Conservation Storage (acre-ft) |
Conservation Capacity (acre-ft) |
Surface Area (acres) |
|
|---|---|---|---|---|---|---|---|
| Today | 2026-07-30 | 84.4 | 546.67 | 33,914 | 33,882 | 40,157 | 1,851 |
| Yesterday | 2026-07-29 | 84.9 | 546.78 | 34,118 | 34,086 | 40,157 | 1,853 |
| 2 days ago | 2026-07-28 | 85.6 | 546.94 | 34,415 | 34,383 | 40,157 | 1,856 |
| 1 week ago | 2026-07-23 | 89.3 | 547.74 | 35,905 | 35,873 | 40,157 | 1,871 |
| 1 month ago | 2026-06-30 | 92.1 | 548.34 | 37,031 | 36,999 | 40,157 | 1,883 |
| 3 months ago | 2026-04-30 | 97.2 | 549.42 | 39,077 | 39,045 | 40,157 | 1,907 |
| 6 months ago | 2026-01-30 | 91.3 | 548.17 | 36,711 | 36,679 | 40,157 | 1,879 |
| 1 year ago | 2025-07-30 | 92.4 | 548.40 | 37,144 | 37,112 | 40,157 | 1,884 |
*
Percent Full is based on Conservation Storage and Conservation Capacity and doesn't account for storage in flood pool.
**
Values above, including today's are averaged conditions. For near real-time instantaneous water level, see table below or the interactive map viewer.
Most Recent Instantaneous Water Level
| Date/time |
Water Level (ft) |
Conservation Pool Elevation (ft) |
Height Above Conservation Pool (ft) |
|
|---|---|---|---|---|
| Most recent | 2026-07-30 16:15 | 546.59 | 550.00 | -3.41 |
| 1 hour prior | 2026-07-30 15:15 | 546.59 | 550.00 | -3.41 |
| 2 hours prior | 2026-07-30 14:15 | 546.62 | 550.00 | -3.38 |
| 6 hours prior | 2026-07-30 10:15 | 546.64 | 550.00 | -3.36 |
| 12 hours prior | 2026-07-30 04:15 | 546.68 | 550.00 | -3.32 |
| 24 hours prior | 2026-07-29 16:15 | 546.75 | 550.00 | -3.25 |
| 48 hours prior | 2026-07-28 16:15 | 546.90 | 550.00 | -3.10 |
*
Data is provisional and subject to revision.
Additional Information
| Impoundment date | 1957-01-01 |
| Vertical datum | NGVD29 |
| Dead pool elevation | 505.00 ft above NGVD29 |
| Service spillway crest elevation | 550.00 ft above NGVD29 |
| Emergency spillway crest elevation | 559.70 ft above NGVD29 |
| Top of dam elevation | 577.50 ft above NGVD29 |
| Conservation pool elevation | 550.00 ft above NGVD29 |
| Data download (CSV) | period of record, last one year, last 30 days |
| Data Source | USGS:08049200 |
| USGS Monitoring Location | USGS:08049200 |
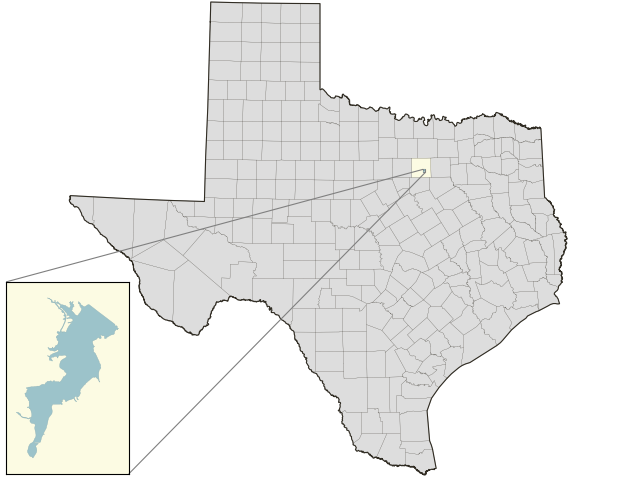
Lake Location