Lake Austin: 94.8% full as of 2026-07-30
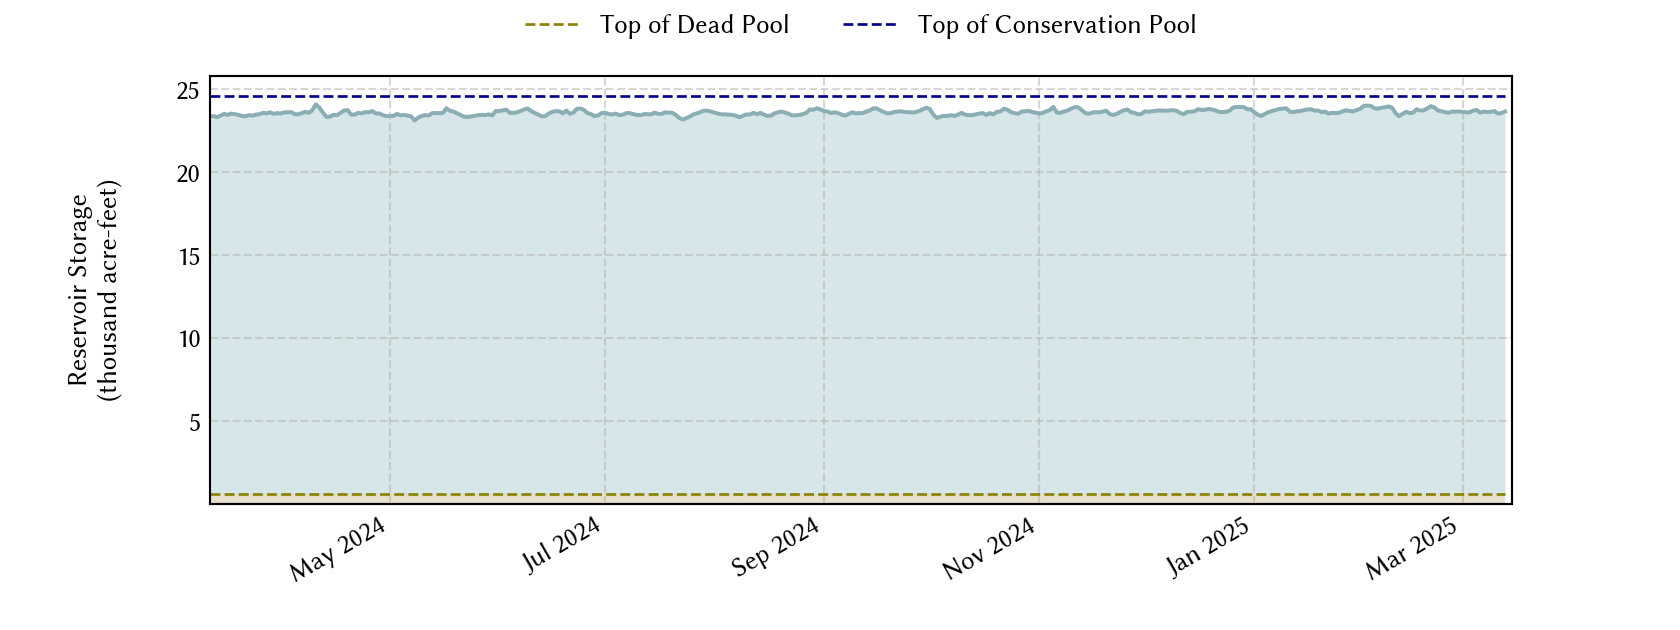
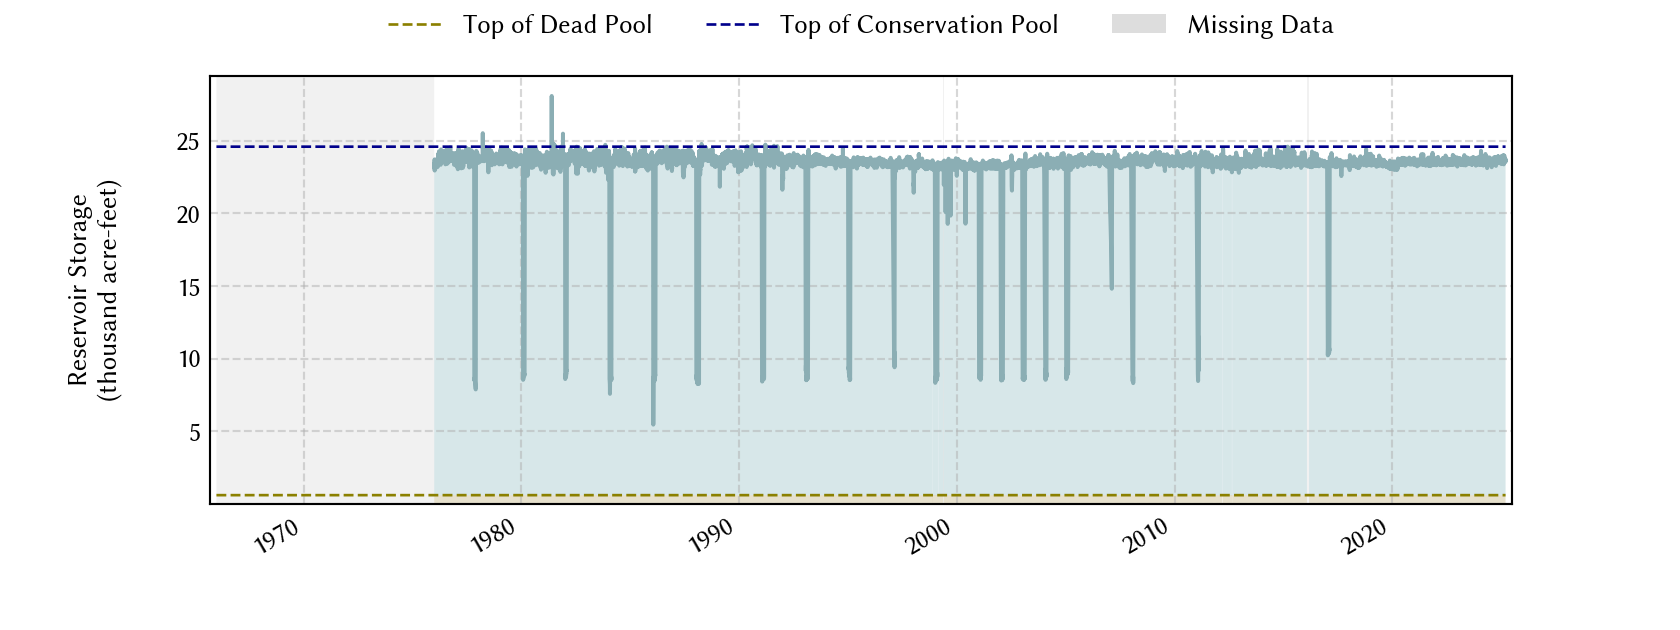
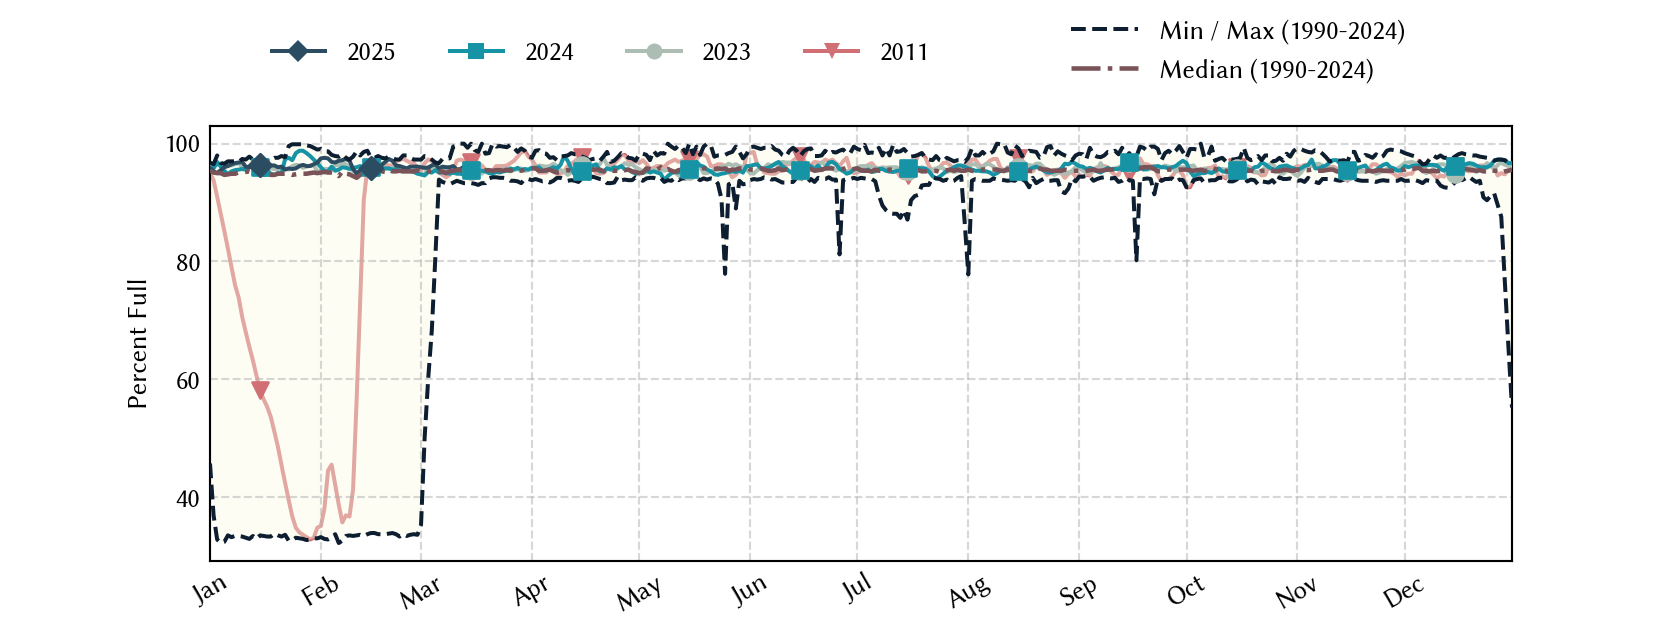
Historical Data
| Date | Percent Full |
Mean Water Level (ft) |
Reservoir Storage (acre-ft) |
Conservation Storage (acre-ft) |
Conservation Capacity (acre-ft) |
Surface Area (acres) |
|
|---|---|---|---|---|---|---|---|
| Today | 2026-07-30 | 94.8 | 492.00 | 23,335 | 22,726 | 23,972 | 1,534 |
| Yesterday | 2026-07-29 | 94.8 | 492.00 | 23,335 | 22,726 | 23,972 | 1,534 |
| 2 days ago | 2026-07-28 | 94.9 | 492.01 | 23,351 | 22,742 | 23,972 | 1,535 |
| 1 week ago | 2026-07-23 | 97.1 | 492.35 | 23,876 | 23,267 | 23,972 | 1,554 |
| 1 month ago | 2026-06-30 | 97.0 | 492.34 | 23,860 | 23,251 | 23,972 | 1,553 |
| 3 months ago | 2026-04-30 | 96.9 | 492.32 | 23,829 | 23,220 | 23,972 | 1,552 |
| 6 months ago | 2026-01-30 | 96.3 | 492.24 | 23,705 | 23,096 | 23,972 | 1,547 |
| 1 year ago | 2025-07-30 | 96.2 | 492.21 | 23,659 | 23,050 | 23,972 | 1,546 |
*
Percent Full is based on Conservation Storage and Conservation Capacity and doesn't account for storage in flood pool.
**
Values above, including today's are averaged conditions. For near real-time instantaneous water level, see table below or the interactive map viewer.
Most Recent Instantaneous Water Level
| Date/time |
Water Level (ft) |
Conservation Pool Elevation (ft) |
Height Above Conservation Pool (ft) |
|
|---|---|---|---|---|
| Most recent | 2026-07-30 16:00 | 491.86 | 492.80 | -0.94 |
| 1 hour prior | 2026-07-30 15:00 | 491.86 | 492.80 | -0.94 |
| 2 hours prior | 2026-07-30 14:00 | 491.87 | 492.80 | -0.93 |
| 6 hours prior | 2026-07-30 10:00 | 491.95 | 492.80 | -0.85 |
| 12 hours prior | 2026-07-30 04:00 | 492.00 | 492.80 | -0.80 |
| 24 hours prior | 2026-07-29 16:00 | 491.92 | 492.80 | -0.88 |
| 48 hours prior | 2026-07-28 16:00 | 491.94 | 492.80 | -0.86 |
*
Data is provisional and subject to revision.
Additional Information
| Impoundment date | 1939-01-01 |
| Vertical datum | NGVD29 -0.04 |
| Dead pool elevation | 462.00 ft above NGVD29 -0.04 |
| Service spillway crest elevation | 480.00 ft above NGVD29 |
| Top of gate elevation | 498.00 ft above NGVD29 |
| Emergency spillway crest elevation | 492.80 ft above NGVD29 |
| Maximum design elevation | 512.00 ft above NGVD29 |
| Top of dam elevation | 519.00 ft above NGVD29 |
| Conservation pool elevation | 492.80 ft above NGVD29 -0.04 |
| Data download (CSV) | period of record, last one year, last 30 days |
Elevation-Area-Capacity Curves
2008-12-01 (source: TWDB)
: GIS Data
|
|
| Data Source | LCRA:3999 |
Lake Location