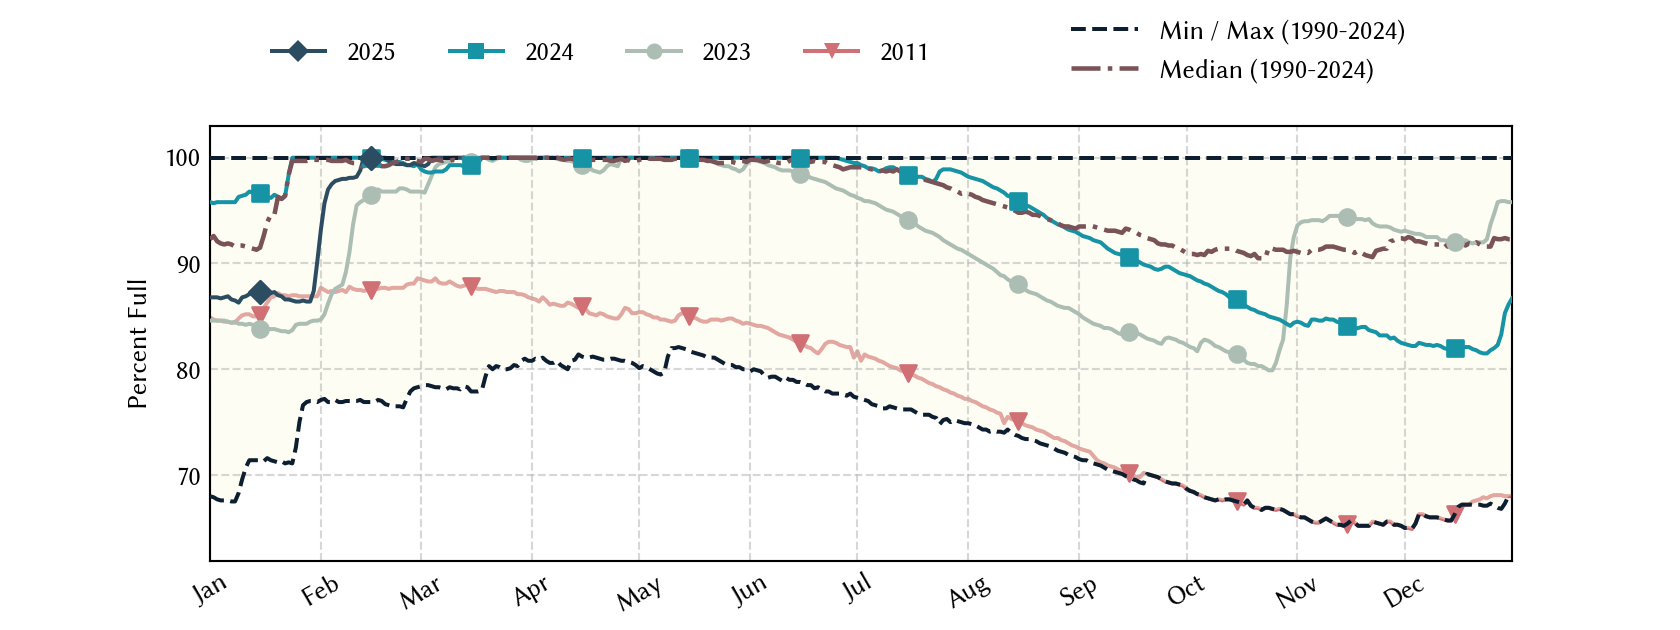
Cedar Creek Reservoir: 82.0% full as of 2026-07-30
Historical Data
| Date | Percent Full |
Mean Water Level (ft) |
Reservoir Storage (acre-ft) |
Conservation Storage (acre-ft) |
Conservation Capacity (acre-ft) |
Surface Area (acres) |
|
|---|---|---|---|---|---|---|---|
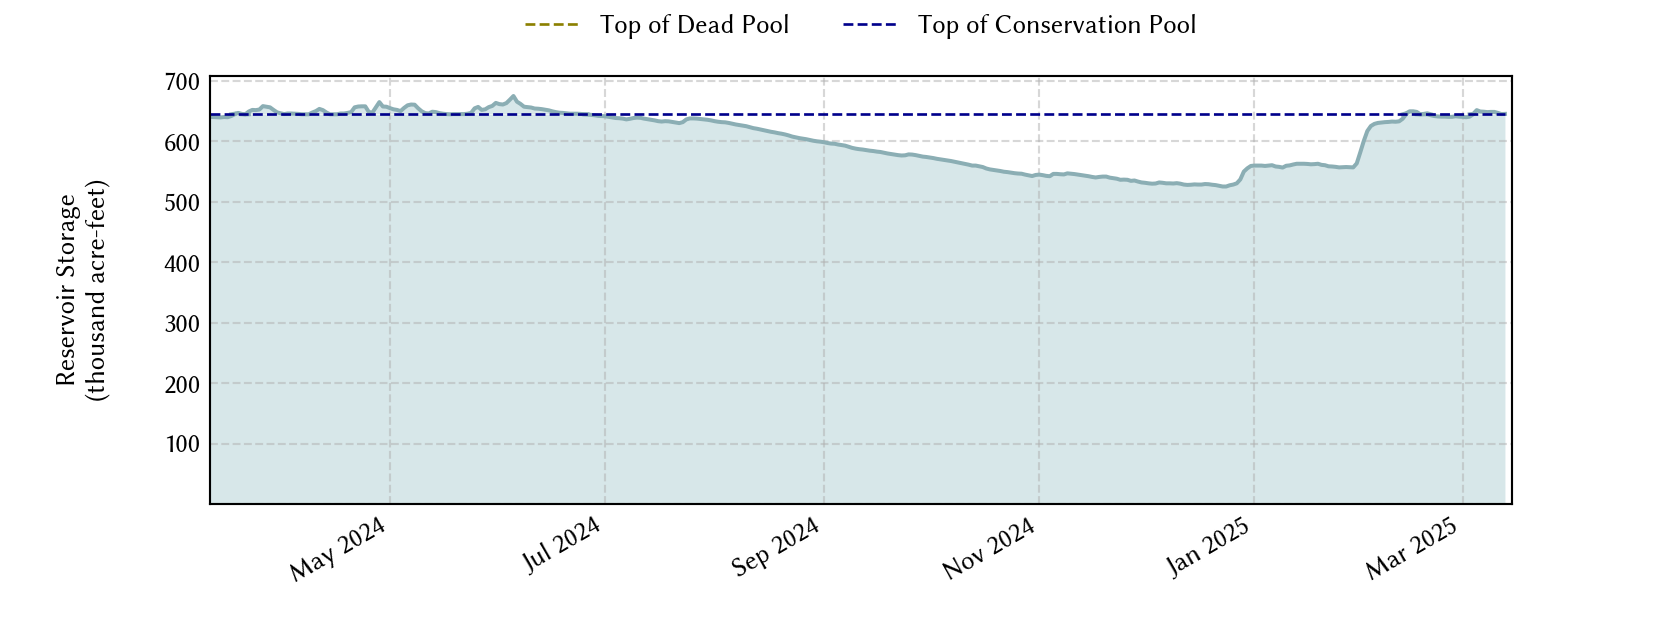
| Today | 2026-07-30 | 82.0 | 318.23 | 528,502 | 528,403 | 644,686 | 29,161 |
| Yesterday | 2026-07-29 | 82.1 | 318.26 | 529,377 | 529,278 | 644,686 | 29,187 |
| 2 days ago | 2026-07-28 | 82.3 | 318.30 | 530,544 | 530,445 | 644,686 | 29,223 |
| 1 week ago | 2026-07-23 | 83.4 | 318.55 | 537,880 | 537,781 | 644,686 | 29,450 |
| 1 month ago | 2026-06-30 | 84.7 | 318.84 | 546,457 | 546,358 | 644,686 | 29,709 |
| 3 months ago | 2026-04-30 | 83.8 | 318.64 | 540,534 | 540,435 | 644,686 | 29,532 |
| 6 months ago | 2026-01-30 | 81.8 | 318.20 | 527,627 | 527,528 | 644,686 | 29,134 |
| 1 year ago | 2025-07-30 | 96.9 | 321.39 | 625,041 | 624,942 | 644,686 | 32,011 |
*
Percent Full is based on Conservation Storage and Conservation Capacity and doesn't account for storage in flood pool.
**
Values above, including today's are averaged conditions. For near real-time instantaneous water level, see table below or the interactive map viewer.
Most Recent Instantaneous Water Level
| Date/time |
Water Level (ft) |
Conservation Pool Elevation (ft) |
Height Above Conservation Pool (ft) |
|
|---|---|---|---|---|
| Most recent | 2026-07-30 15:45 | 318.21 | 322.00 | -3.79 |
| 1 hour prior | 2026-07-30 14:45 | 318.22 | 322.00 | -3.78 |
| 2 hours prior | 2026-07-30 13:45 | 318.22 | 322.00 | -3.78 |
| 6 hours prior | 2026-07-30 09:45 | 318.22 | 322.00 | -3.78 |
| 12 hours prior | 2026-07-30 03:45 | 318.24 | 322.00 | -3.76 |
| 24 hours prior | 2026-07-29 15:45 | 318.25 | 322.00 | -3.75 |
| 48 hours prior | 2026-07-28 15:45 | 318.29 | 322.00 | -3.71 |
*
Data is provisional and subject to revision.
Additional Information
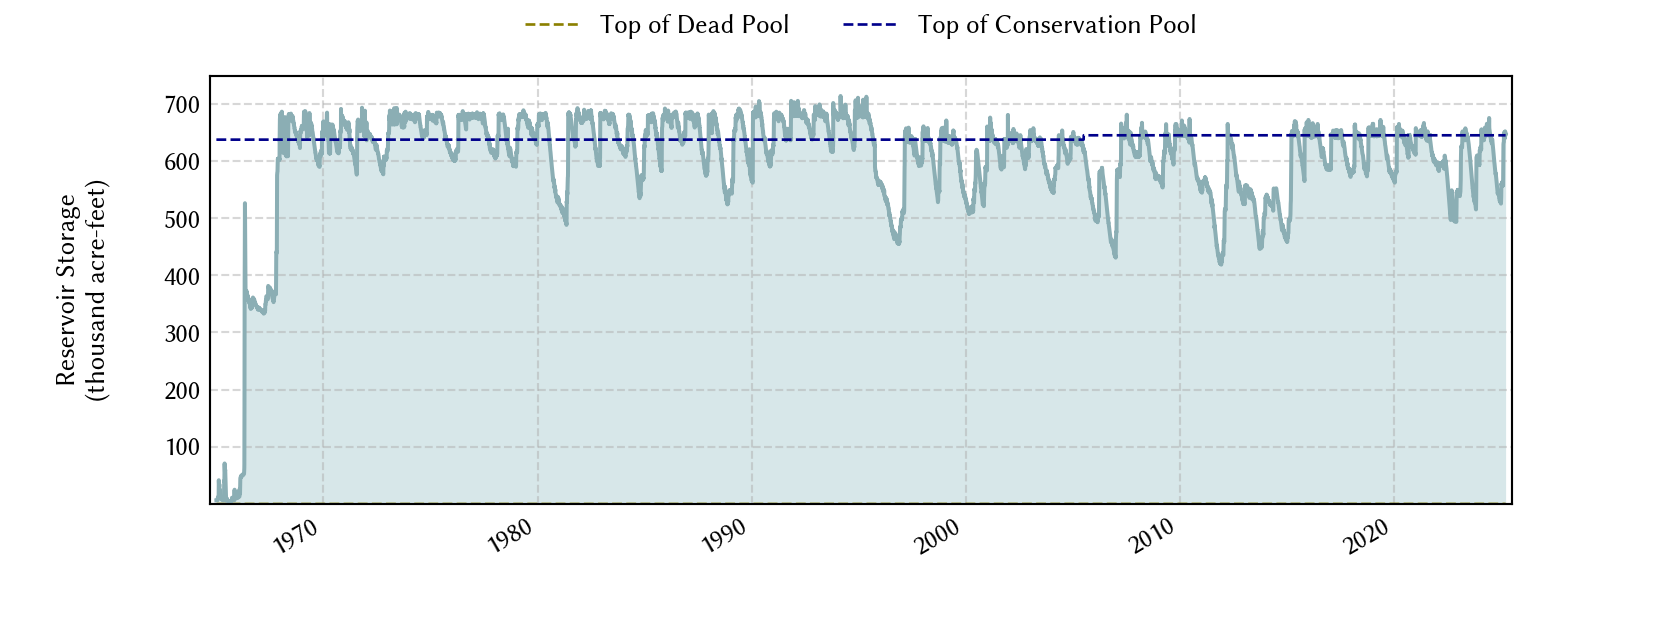
| Impoundment date | 1966-01-01 |
| Vertical datum | NGVD29 |
| Dead pool elevation | 263.50 ft above NGVD29 |
| Service spillway crest elevation | 302.00 ft above NGVD29 |
| Top of gate elevation | 325.00 ft above NGVD29 |
| Top of dam elevation | 340.00 ft above NGVD29 |
| Conservation pool elevation | 322.00 ft above NGVD29 |
| Data download (CSV) | period of record, last one year, last 30 days |
| Data Source | USGS:08063010 |
| USGS Monitoring Location | USGS:08063010 |
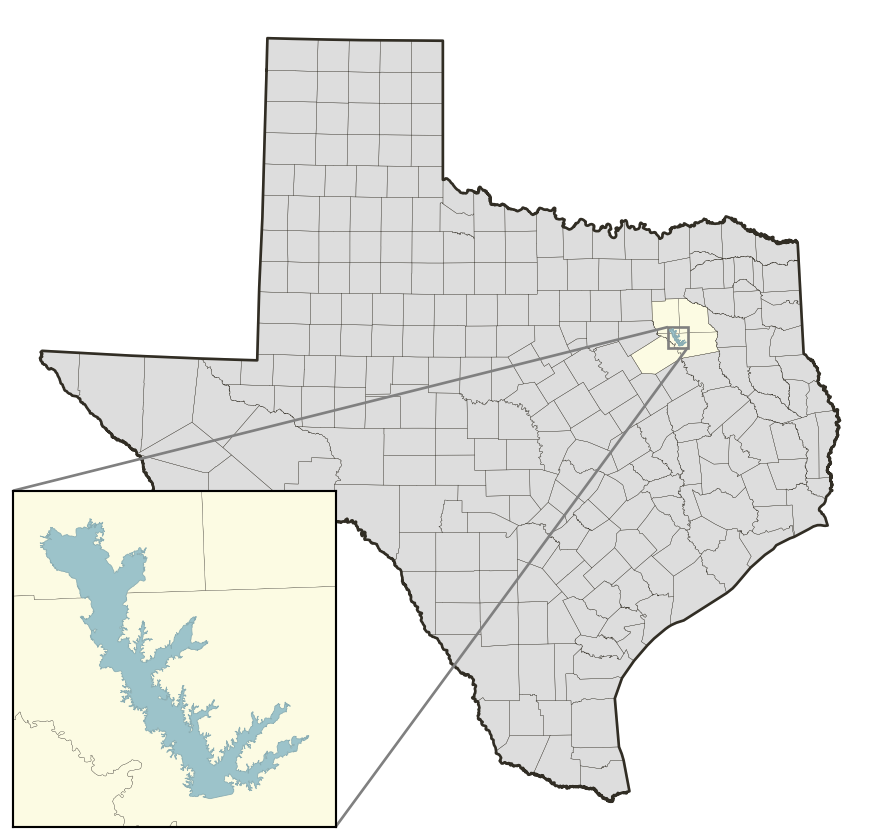
Lake Location