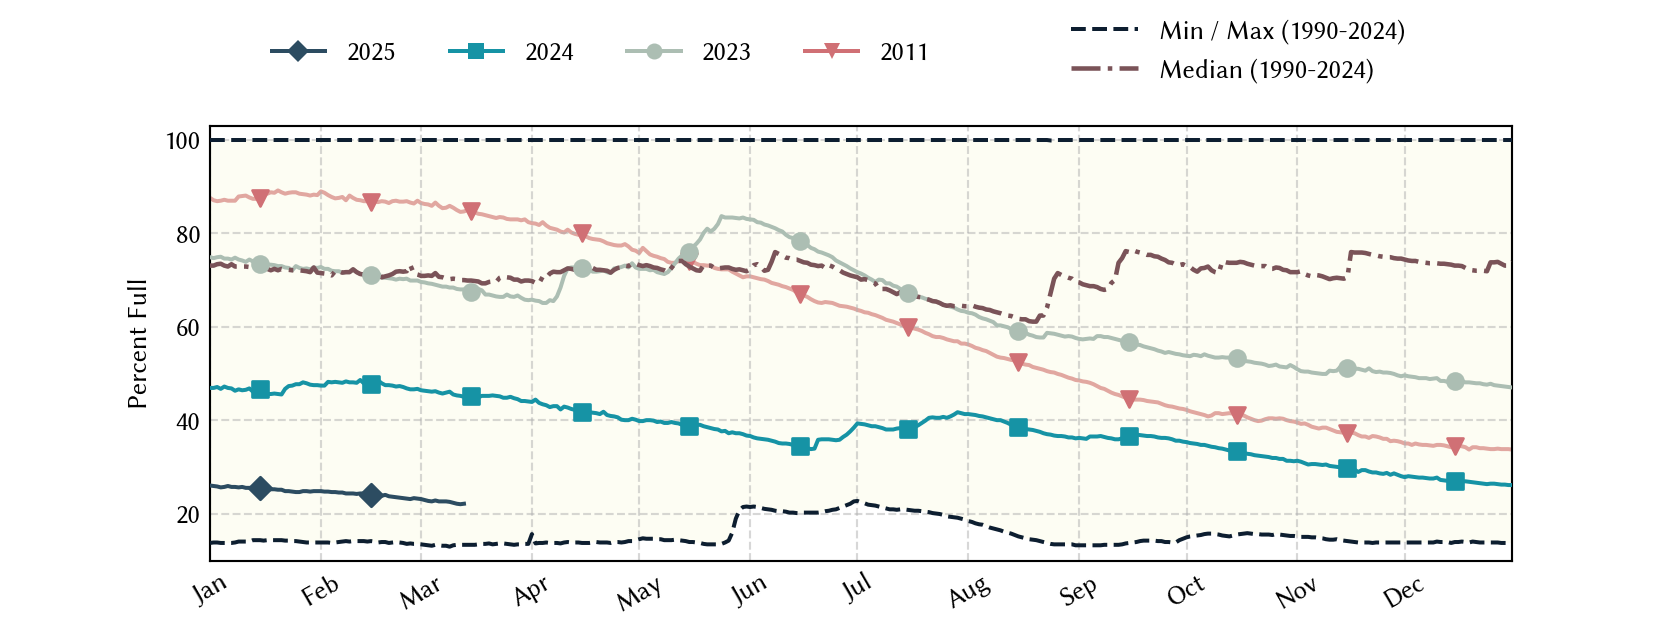
Lake Corpus Christi: 33.6% full as of 2026-07-30
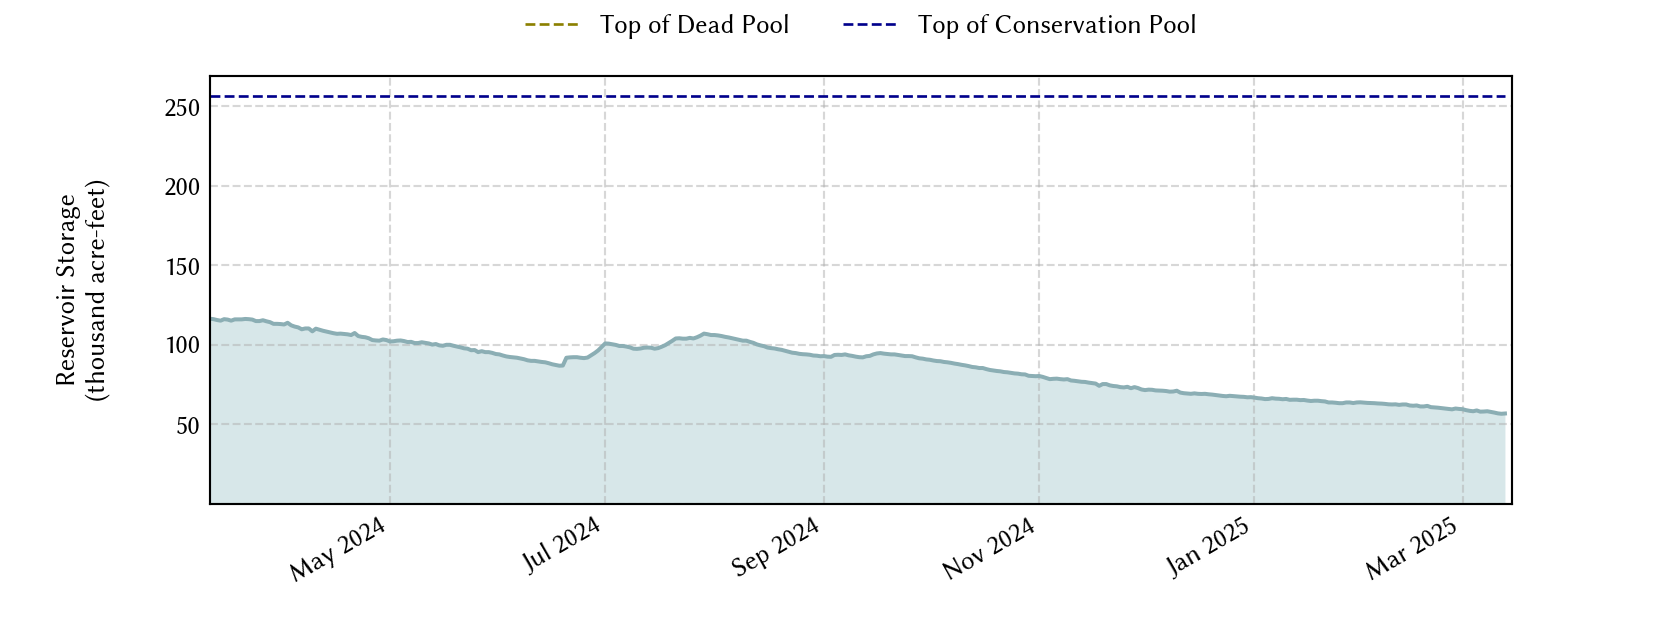
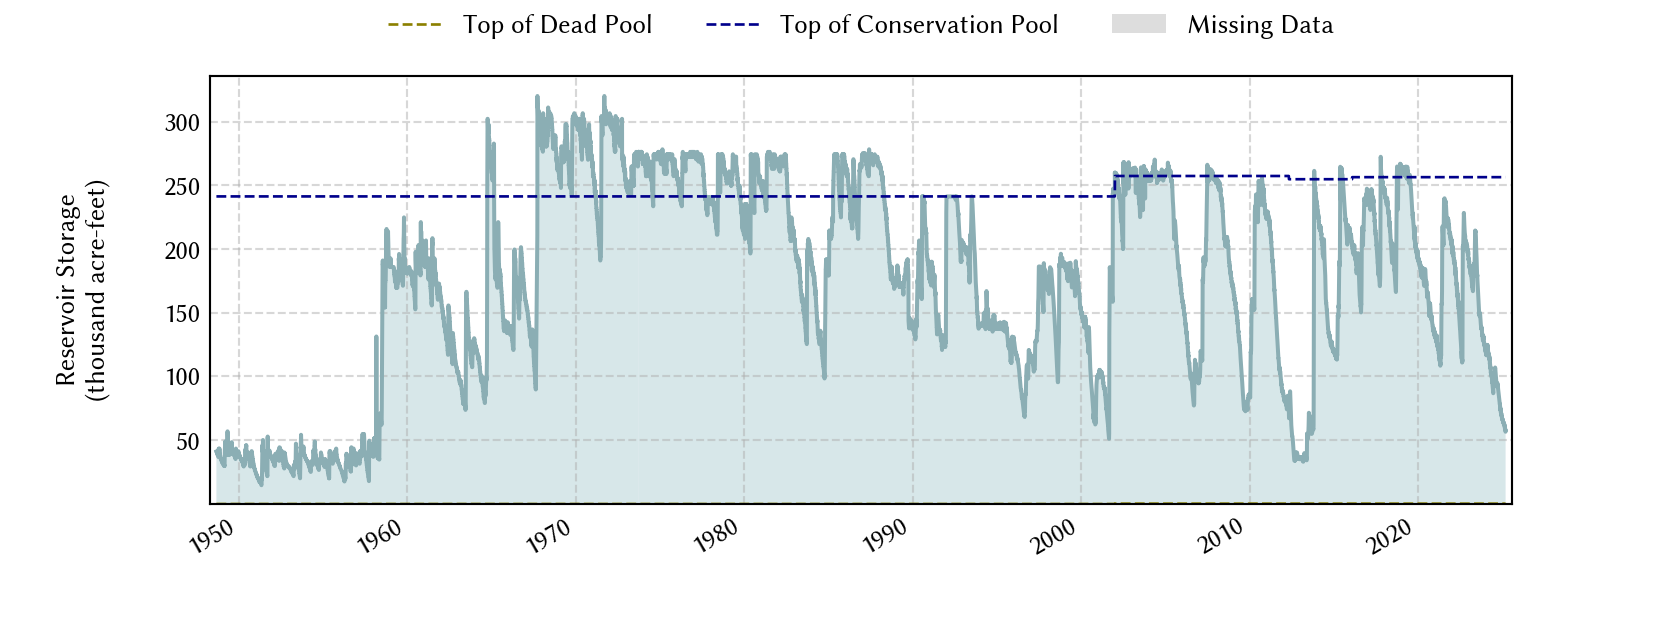
Historical Data
| Date | Percent Full |
Mean Water Level (ft) |
Reservoir Storage (acre-ft) |
Conservation Storage (acre-ft) |
Conservation Capacity (acre-ft) |
Surface Area (acres) |
|
|---|---|---|---|---|---|---|---|
| Today | 2026-07-30 | 33.6 | 83.25 | 86,210 | 85,932 | 256,062 | 11,123 |
| Yesterday | 2026-07-29 | 32.7 | 83.04 | 83,894 | 83,616 | 256,062 | 10,935 |
| 2 days ago | 2026-07-28 | 32.1 | 82.92 | 82,589 | 82,311 | 256,062 | 10,817 |
| 1 week ago | 2026-07-23 | 32.5 | 83.01 | 83,567 | 83,289 | 256,062 | 10,906 |
| 1 month ago | 2026-06-30 | 35.1 | 83.60 | 90,160 | 89,882 | 256,062 | 11,459 |
| 3 months ago | 2026-04-30 | 8.7 | 74.92 | 22,540 | 22,262 | 256,062 | 4,766 |
| 6 months ago | 2026-01-30 | 11.1 | 76.12 | 28,720 | 28,442 | 256,062 | 5,508 |
| 1 year ago | 2025-07-30 | 19.5 | 79.38 | 50,094 | 49,816 | 256,062 | 7,657 |
*
Percent Full is based on Conservation Storage and Conservation Capacity and doesn't account for storage in flood pool.
**
Values above, including today's are averaged conditions. For near real-time instantaneous water level, see table below or the interactive map viewer.
Most Recent Instantaneous Water Level
| Date/time |
Water Level (ft) |
Conservation Pool Elevation (ft) |
Height Above Conservation Pool (ft) |
|
|---|---|---|---|---|
| Most recent | 2026-07-30 16:00 | 83.45 | 94.00 | -10.55 |
| 1 hour prior | 2026-07-30 15:00 | 83.43 | 94.00 | -10.57 |
| 2 hours prior | 2026-07-30 14:00 | 83.42 | 94.00 | -10.58 |
| 6 hours prior | 2026-07-30 10:00 | 83.32 | 94.00 | -10.68 |
| 12 hours prior | 2026-07-30 04:00 | 83.22 | 94.00 | -10.78 |
| 24 hours prior | 2026-07-29 16:00 | 83.06 | 94.00 | -10.94 |
| 48 hours prior | 2026-07-28 16:00 | 82.94 | 94.00 | -11.06 |
*
Data is provisional and subject to revision.
Additional Information
| Impoundment date | 1958-01-01 |
| Vertical datum | NGVD29 |
| Dead pool elevation | 55.50 ft above NGVD29 |
| Service spillway crest elevation | 93.80 ft above NGVD29 |
| Top of gate elevation | 94.30 ft above NGVD29 |
| Emergency spillway crest elevation | 88.00 ft above NGVD29 |
| Top of dam elevation | 106.00 ft above NGVD29 |
| Conservation pool elevation | 94.00 ft above NGVD29 |
| Data download (CSV) | period of record, last one year, last 30 days |
Elevation-Area-Capacity Curves
1958-01-01 (source: USGS)
2002-01-01 (source: TWDB)
: GIS Data
2012-05-01 (source: TWDB)
: GIS Data
2016-02-01 (source: TWDB)
: GIS Data
|
|
| Data Source | USGS:08210500 |
| USGS Monitoring Location | USGS:08210500 |
Lake Location