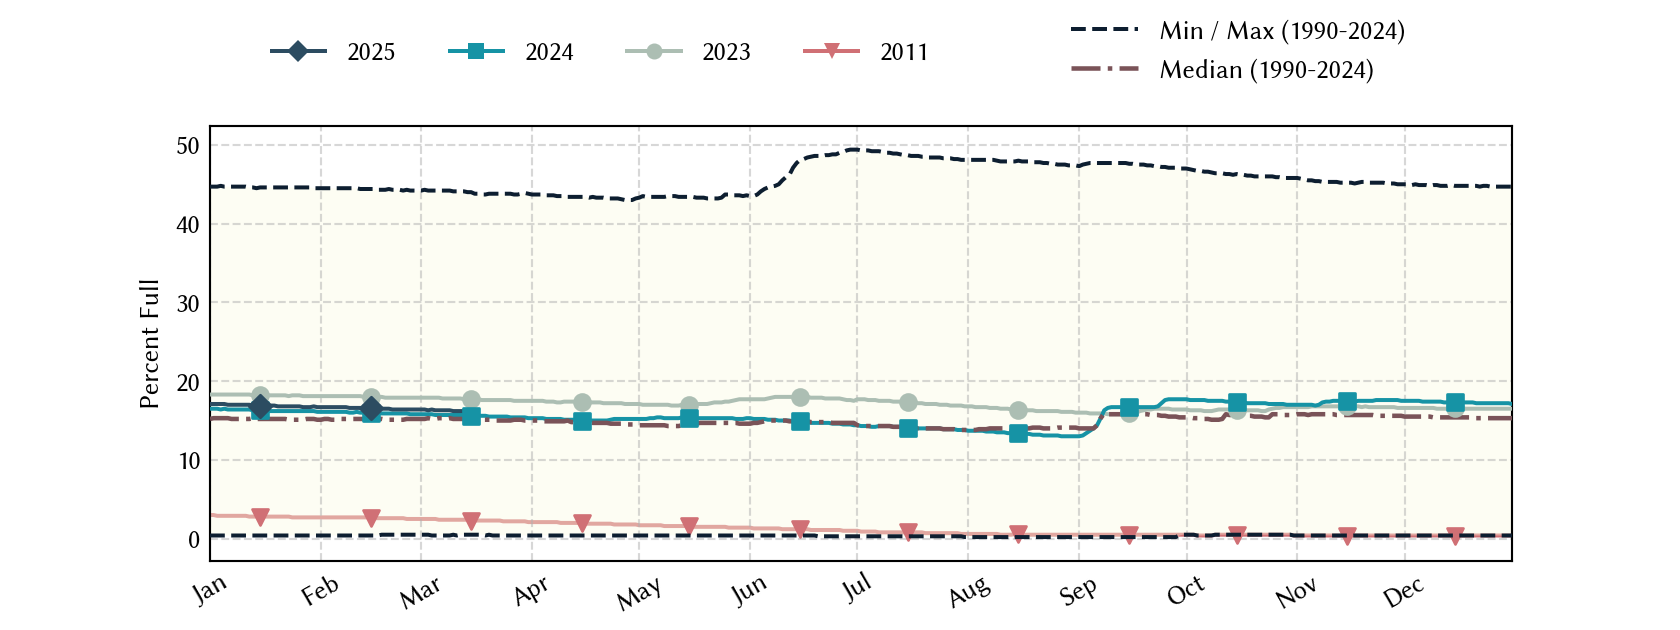
E. V. Spence Reservoir: 10.8% full as of 2026-07-30
Historical Data
| Date | Percent Full |
Mean Water Level (ft) |
Reservoir Storage (acre-ft) |
Conservation Storage (acre-ft) |
Conservation Capacity (acre-ft) |
Surface Area (acres) |
|
|---|---|---|---|---|---|---|---|
| Today | 2026-07-30 | 10.8 | 1,844.30 | 55,644 | 55,644 | 517,272 | 3,549 |
| Yesterday | 2026-07-29 | 10.8 | 1,844.33 | 55,751 | 55,751 | 517,272 | 3,555 |
| 2 days ago | 2026-07-28 | 10.8 | 1,844.37 | 55,893 | 55,893 | 517,272 | 3,562 |
| 1 week ago | 2026-07-23 | 10.9 | 1,844.51 | 56,393 | 56,393 | 517,272 | 3,586 |
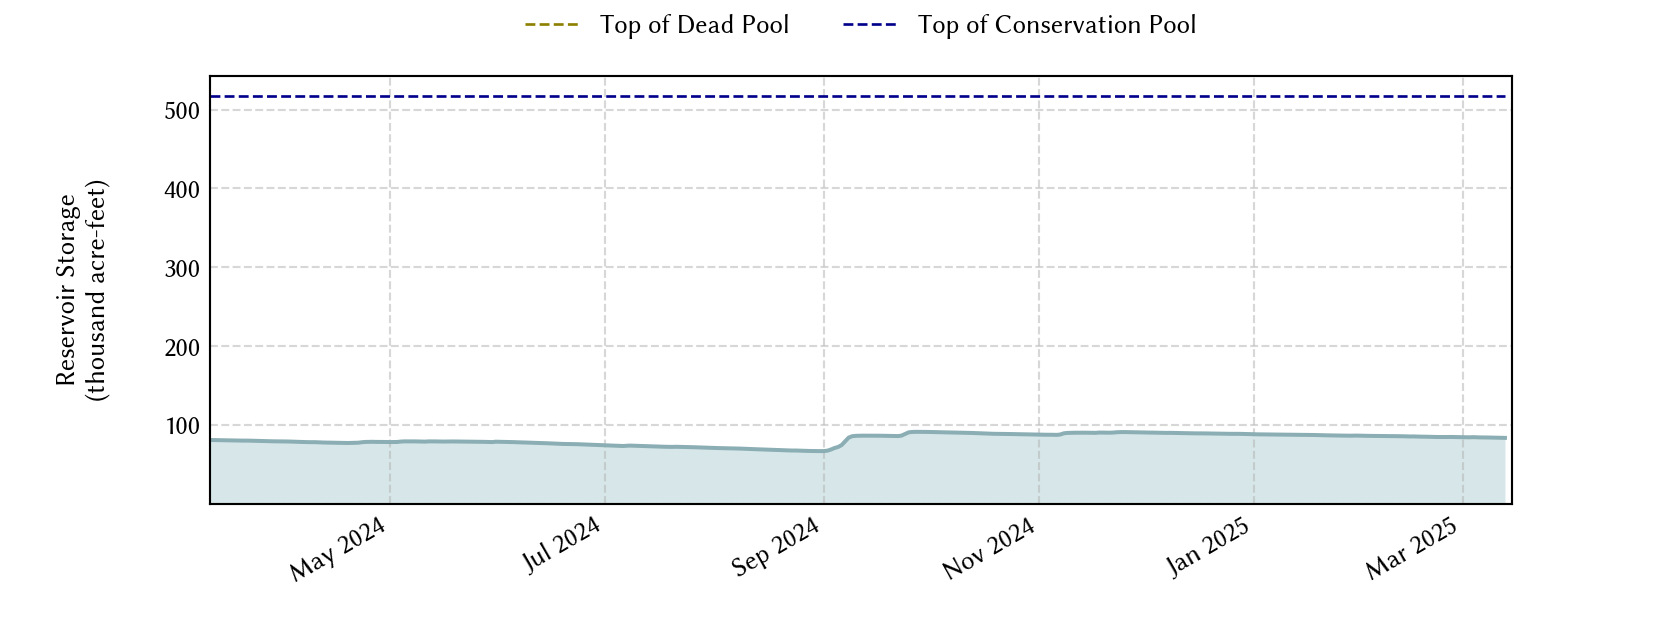
| 1 month ago | 2026-06-30 | 10.7 | 1,844.20 | 55,290 | 55,290 | 517,272 | 3,532 |
| 3 months ago | 2026-04-30 | 11.4 | 1,845.16 | 58,770 | 58,770 | 517,272 | 3,760 |
| 6 months ago | 2026-01-30 | 12.2 | 1,846.27 | 63,016 | 63,016 | 517,272 | 3,884 |
| 1 year ago | 2025-07-30 | 15.1 | 1,849.89 | 78,006 | 78,006 | 517,272 | 4,439 |
*
Percent Full is based on Conservation Storage and Conservation Capacity and doesn't account for storage in flood pool.
**
Values above, including today's are averaged conditions. For near real-time instantaneous water level, see table below or the interactive map viewer.
Most Recent Instantaneous Water Level
| Date/time |
Water Level (ft) |
Conservation Pool Elevation (ft) |
Height Above Conservation Pool (ft) |
|
|---|---|---|---|---|
| Most recent | 2026-07-30 16:00 | 1,844.29 | 1,898.00 | -53.71 |
| 1 hour prior | 2026-07-30 15:00 | 1,844.30 | 1,898.00 | -53.70 |
| 2 hours prior | 2026-07-30 14:00 | 1,844.30 | 1,898.00 | -53.70 |
| 6 hours prior | 2026-07-30 10:00 | 1,844.30 | 1,898.00 | -53.70 |
| 12 hours prior | 2026-07-30 04:00 | 1,844.30 | 1,898.00 | -53.70 |
| 24 hours prior | 2026-07-29 16:00 | 1,844.34 | 1,898.00 | -53.66 |
| 48 hours prior | 2026-07-28 16:00 | 1,844.37 | 1,898.00 | -53.63 |
*
Data is provisional and subject to revision.
Additional Information
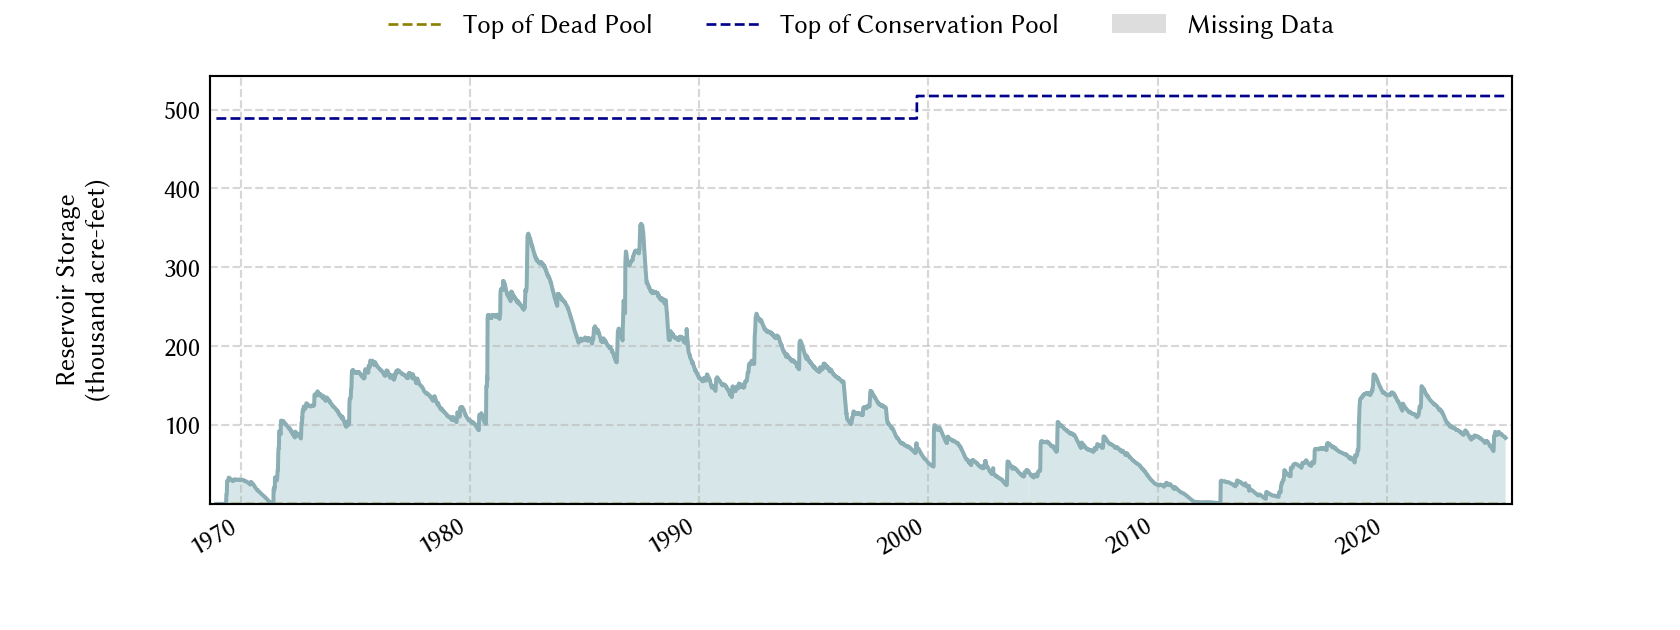
| Impoundment date | 1969-01-01 |
| Vertical datum | NGVD29 |
| Dead pool elevation | 1,790.00 ft above NGVD29 |
| Service spillway crest elevation | 1,878.00 ft above NGVD29 |
| Emergency spillway crest elevation | 1,908.00 ft above NGVD29 |
| Top of dam elevation | 1,928.00 ft above NGVD29 |
| Conservation pool elevation | 1,898.00 ft above NGVD29 |
| Data download (CSV) | period of record, last one year, last 30 days |
| Data Source | USGS:08123950 |
| USGS Monitoring Location | USGS:08123950 |
Lake Location