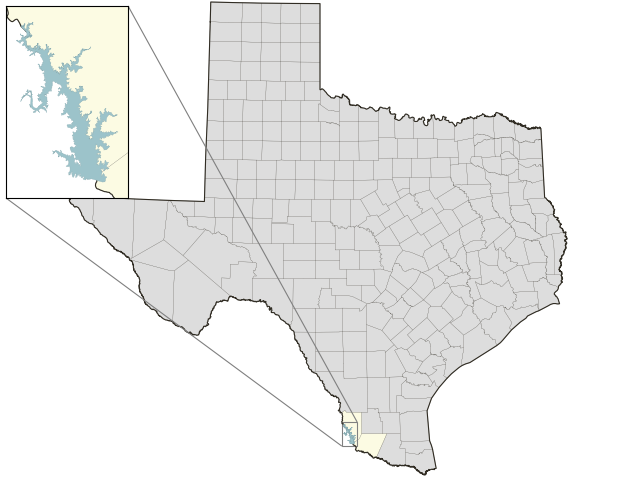
Falcon Reservoir: 20.6% full as of 2026-09-19
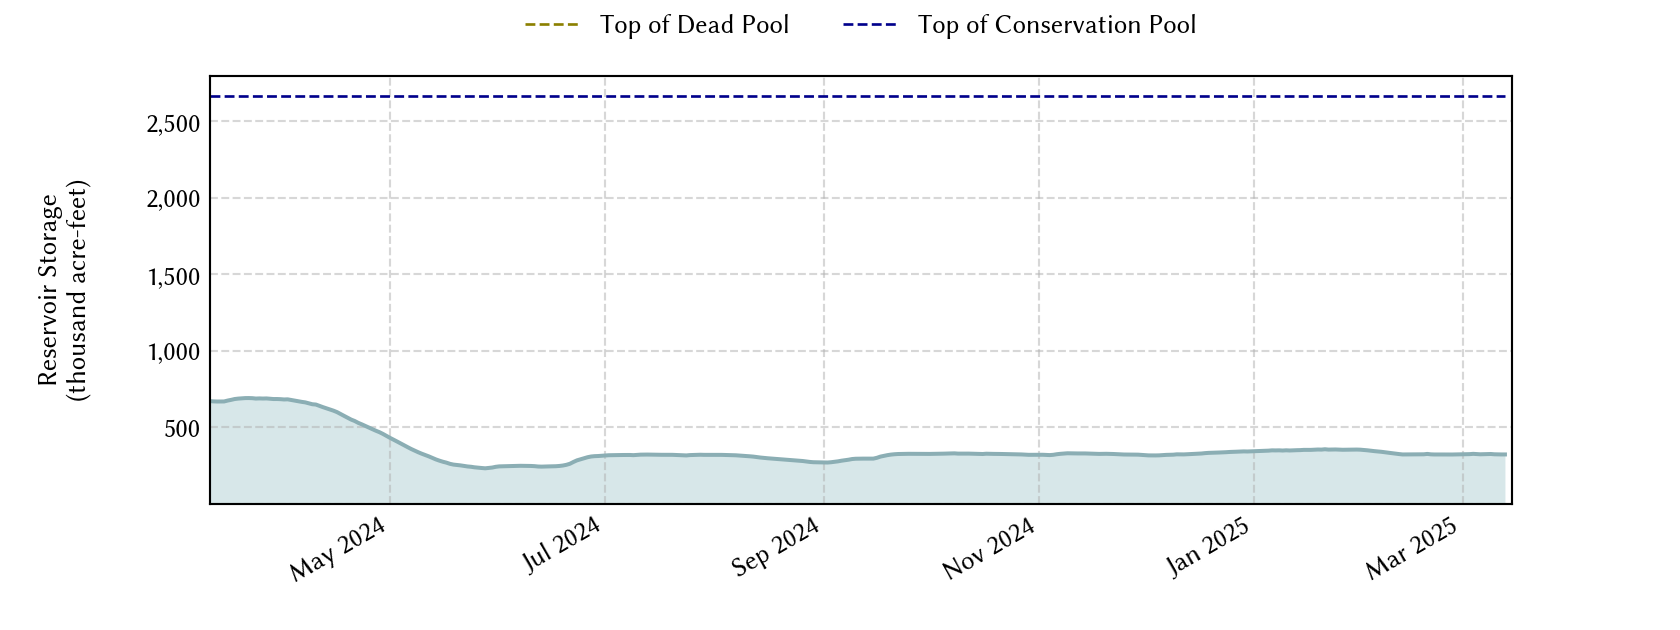
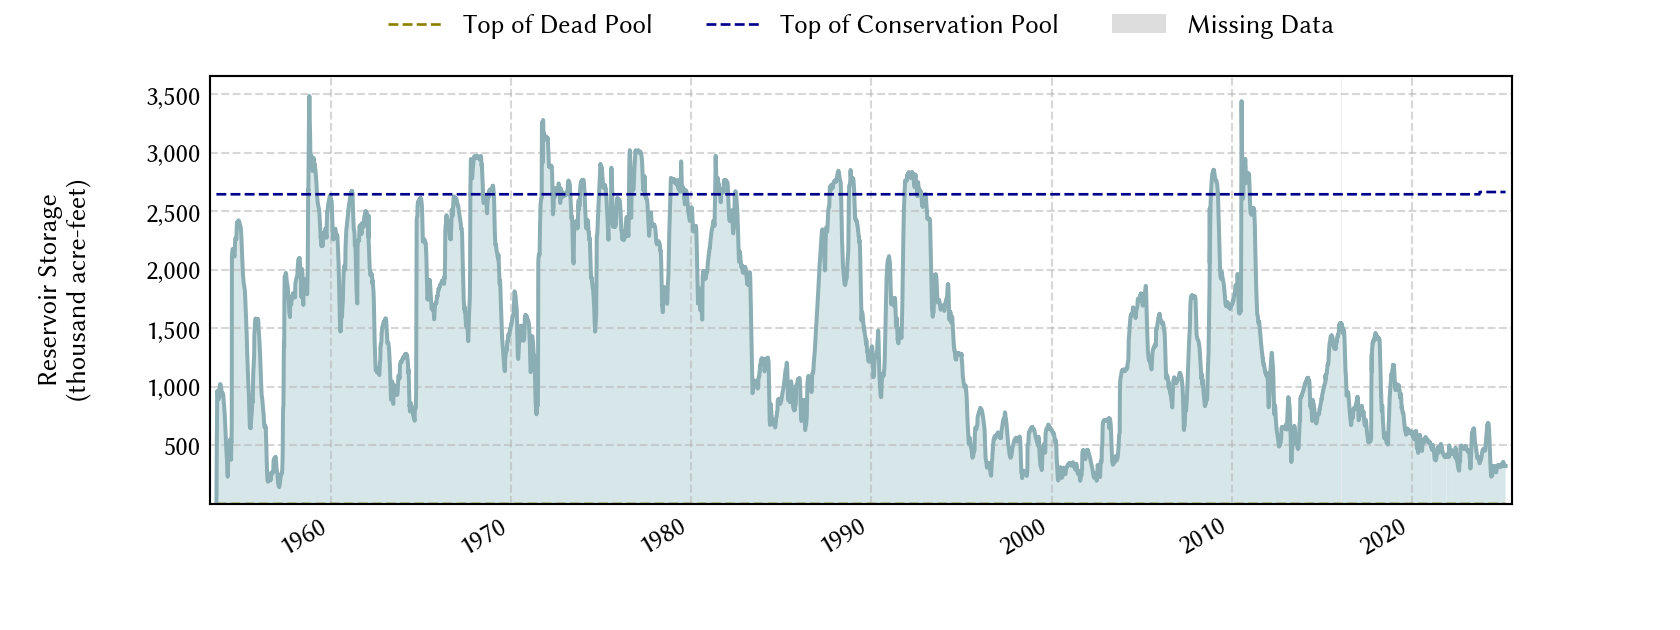
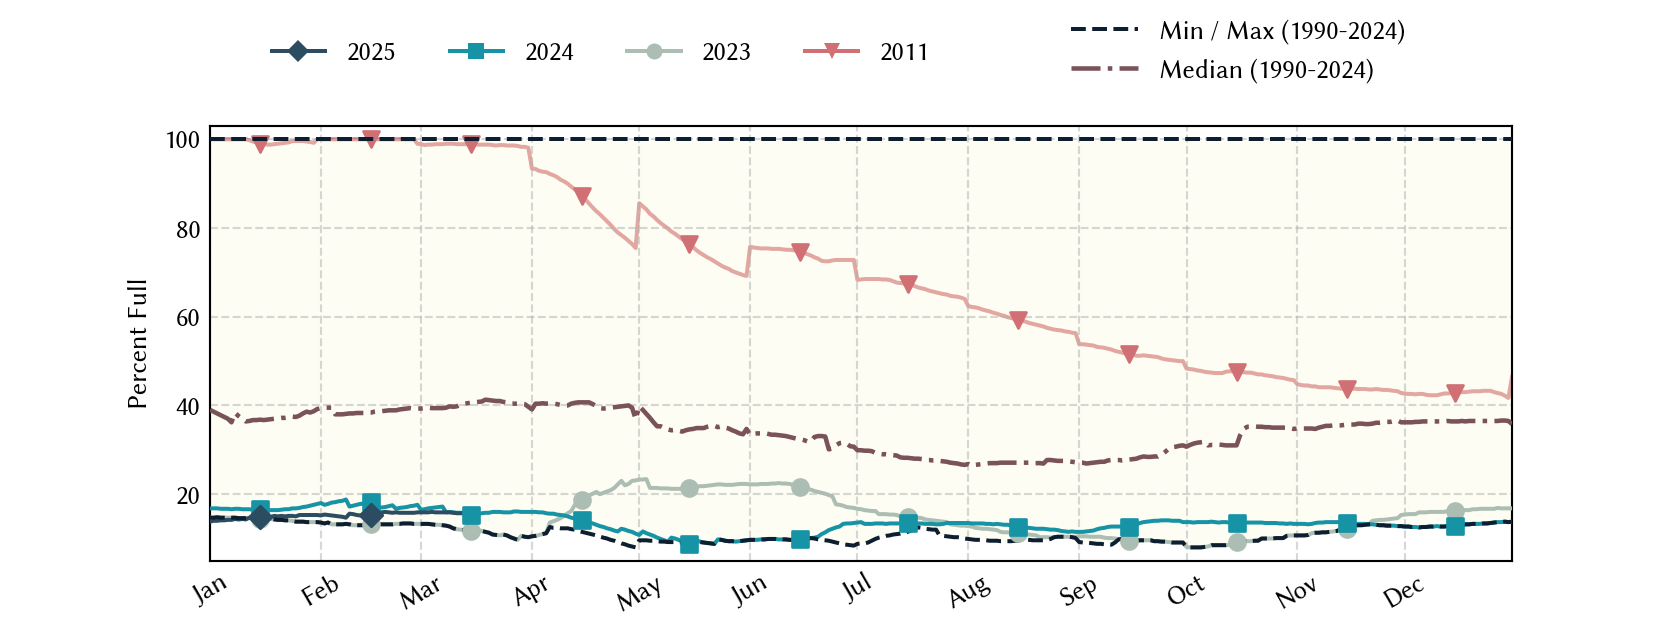
Lake Falcon straddles the border of Texas and Mexico. By treaty, Texas has rights 58.6% of the total conservation capacity. The fraction of the actual storage that belongs to Texas is formally determined biweekly by the International Boundary Water Commission (IBWC). The IBWC is the legal repository of data related to this lake for treaty purposes and official versions of the datasets should be obtained directly from them. Conservation capacity is based on 58.6% of total conservation capacity. Conservation storage is based on the bi-weekly changing Texas share.
Historical Data
| Date | Percent Full |
Mean Water Level (ft) |
Reservoir Storage (acre-ft) |
Conservation Storage (acre-ft) |
Conservation Capacity (acre-ft) |
Surface Area (acres) |
|
|---|---|---|---|---|---|---|---|
| Today | 2026-09-19 | 20.6 | 260.95 | 451,602 | 322,245 | 1,562,367 | 27,884 |
| Yesterday | 2026-09-18 | 20.7 | 260.98 | 452,509 | 322,892 | 1,562,367 | 27,919 |
| 2 days ago | 2026-09-17 | 20.7 | 261.04 | 454,299 | 324,169 | 1,562,367 | 27,991 |
| 1 week ago | 2026-09-12 | 21.4 | 261.46 | 466,367 | 333,995 | 1,562,367 | 28,468 |
| 1 month ago | 2026-08-19 | 24.3 | 263.47 | 525,663 | 380,284 | 1,562,367 | 30,574 |
| 3 months ago | 2026-06-19 | 25.8 | 262.72 | 502,902 | 402,792 | 1,562,367 | 29,854 |
| 6 months ago | 2026-03-19 | 20.5 | 257.58 | 364,779 | 319,948 | 1,562,367 | 23,649 |
| 1 year ago | 2025-09-19 | 15.7 | 254.17 | 290,418 | 244,856 | 1,562,367 | 19,994 |
Percent Full is based on Conservation Storage and Conservation Capacity and doesn't account for storage in flood pool.
Values above, including today's are averaged conditions. For near real-time instantaneous water level, see table below or the interactive map viewer.
Most Recent Instantaneous Water Level
| Date/time |
Water Level (ft) |
Conservation Pool Elevation (ft) |
Height Above Conservation Pool (ft) |
|
|---|---|---|---|---|
| Most recent | 2026-09-19 03:00 | 260.94 | 301.20 | -40.26 |
| 1 hour prior | 2026-09-19 02:00 | 260.94 | 301.20 | -40.26 |
| 2 hours prior | 2026-09-19 01:00 | 260.94 | 301.20 | -40.26 |
| 6 hours prior | 2026-09-18 21:00 | 260.96 | 301.20 | -40.24 |
| 12 hours prior | 2026-09-18 15:00 | 260.97 | 301.20 | -40.23 |
| 24 hours prior | 2026-09-18 03:00 | 261.00 | 301.20 | -40.20 |
| 48 hours prior | 2026-09-17 03:00 | 261.06 | 301.20 | -40.14 |
Data is provisional and subject to revision.
Additional Information
| Impoundment date | 1954-01-01 |
| Vertical datum | NGVD29 |
| Dead pool elevation | 204.34 ft above NGVD29 |
|
Volume under conservation pool elevation |
2,666,203.00 ac-ft |
|
Volume under conservation pool elevation |
2,646,817.00 ac-ft |
| Dead pool volume | 47.00 ac-ft |
| Top of gate elevation | 306.70 ft above NGVD29 |
| Flood pool elevation | 306.70 ft above NGVD29 |
| Maximum design elevation | 314.20 ft above NGVD29 |
| Top of dam elevation | 323.00 ft above NGVD29 |
|
Conservation pool elevation |
301.20 ft above NGVD29 |
|
Conservation pool elevation |
301.10 ft above NGVD29 |
| Data download (CSV) | period of record, last one year, last 30 days |
Elevation-Area-Capacity Curves
2014-01-01 (source: IBWC)
|
|
| Data Source | IBWC:08-4612.00 |
Lake Location