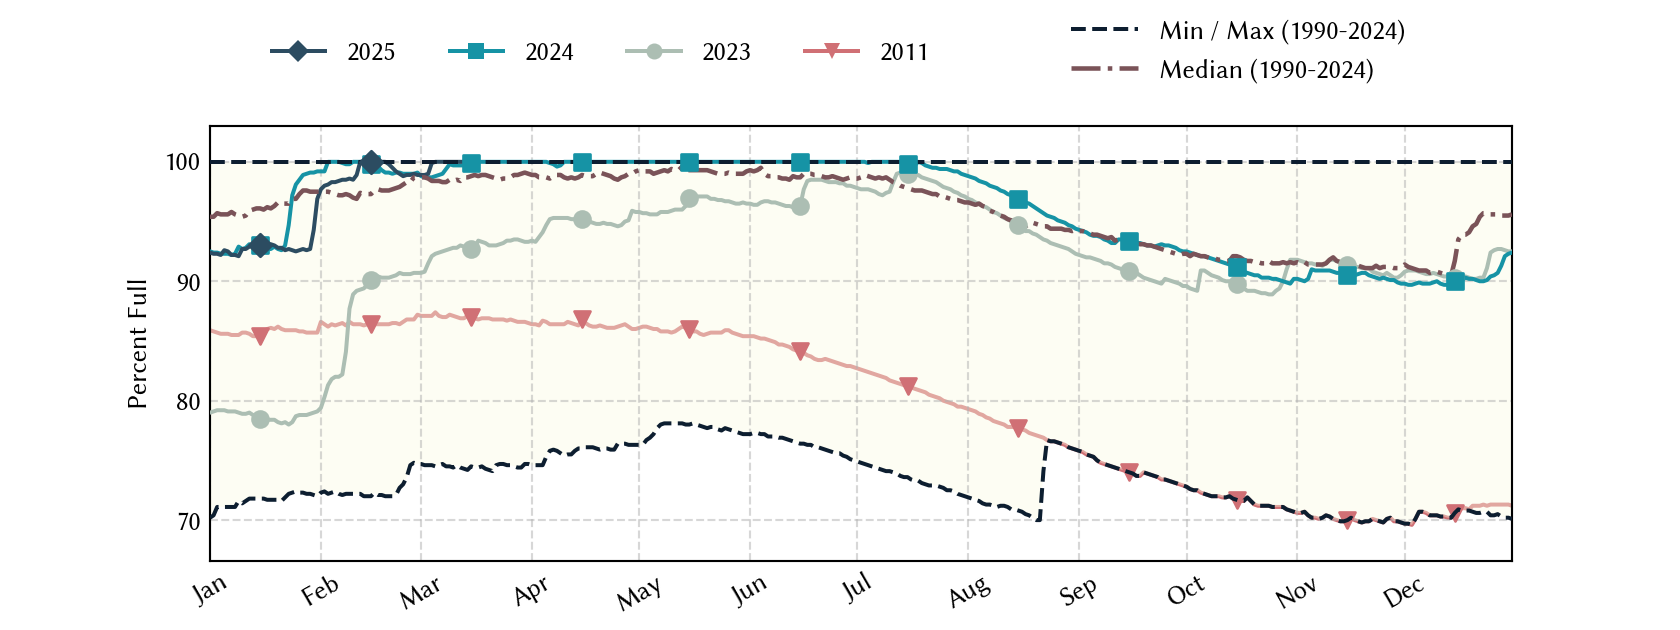
Lake Fork Reservoir: 88.2% full as of 2026-07-29
Historical Data
| Date | Percent Full |
Mean Water Level (ft) |
Reservoir Storage (acre-ft) |
Conservation Storage (acre-ft) |
Conservation Capacity (acre-ft) |
Surface Area (acres) |
|
|---|---|---|---|---|---|---|---|
| Today | 2026-07-29 | 88.2 | 400.22 | 566,290 | 534,847 | 606,088 | 24,363 |
| Yesterday | 2026-07-28 | 88.3 | 400.24 | 566,778 | 535,335 | 606,088 | 24,382 |
| 2 days ago | 2026-07-27 | 88.4 | 400.27 | 567,510 | 536,067 | 606,088 | 24,409 |
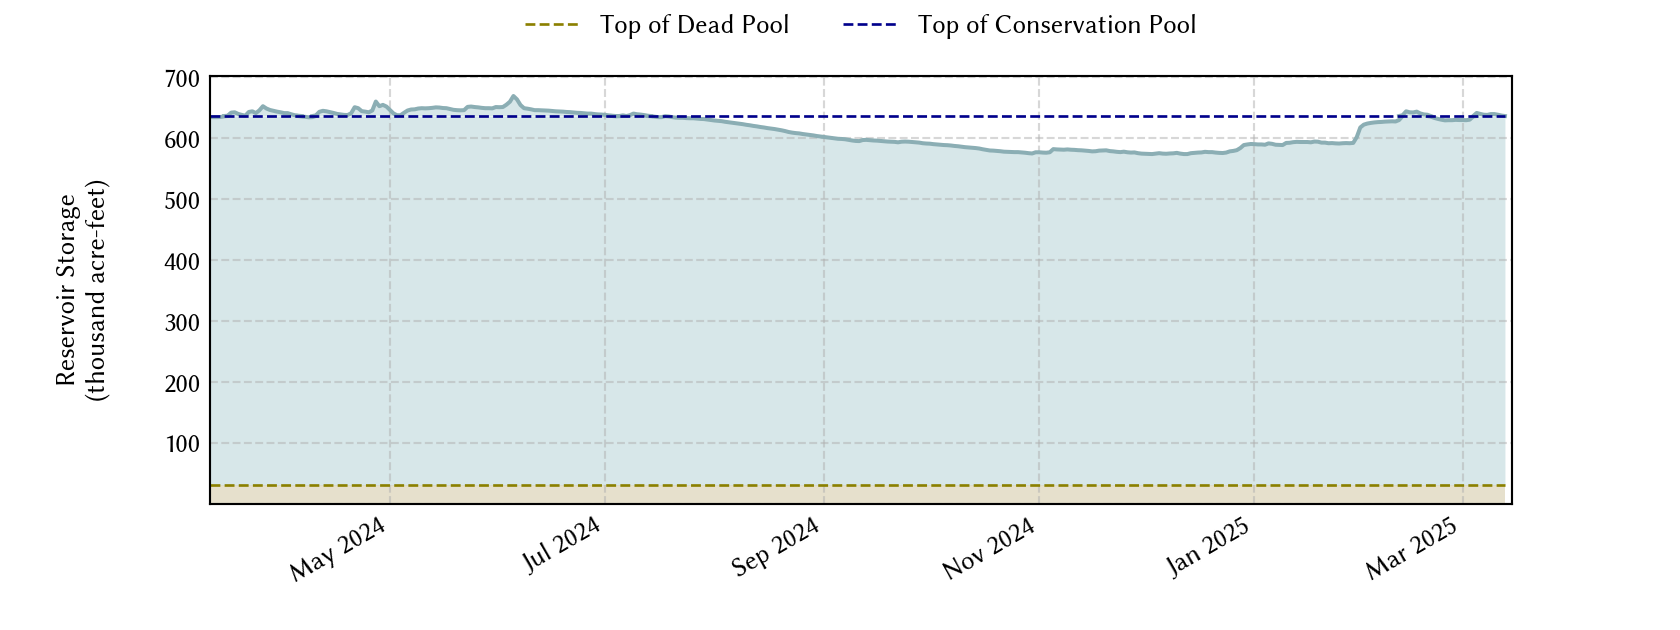
| 1 week ago | 2026-07-22 | 89.3 | 400.47 | 572,410 | 540,967 | 606,088 | 24,591 |
| 1 month ago | 2026-06-29 | 91.4 | 401.00 | 585,569 | 554,126 | 606,088 | 25,072 |
| 3 months ago | 2026-04-29 | 89.2 | 400.46 | 572,164 | 540,721 | 606,088 | 24,581 |
| 6 months ago | 2026-01-29 | 87.3 | 399.98 | 560,469 | 529,026 | 606,088 | 24,153 |
| 1 year ago | 2025-07-29 | 100.0 | 403.07 | 639,484 | 606,088 | 606,088 | 26,948 |
*
Percent Full is based on Conservation Storage and Conservation Capacity and doesn't account for storage in flood pool.
**
Values above, including today's are averaged conditions. For near real-time instantaneous water level, see table below or the interactive map viewer.
Most Recent Instantaneous Water Level
| Date/time |
Water Level (ft) |
Conservation Pool Elevation (ft) |
Height Above Conservation Pool (ft) |
|
|---|---|---|---|---|
| Most recent | 2026-07-29 15:30 | 400.20 | 403.00 | -2.80 |
| 1 hour prior | 2026-07-29 14:30 | 400.20 | 403.00 | -2.80 |
| 2 hours prior | 2026-07-29 13:30 | 400.20 | 403.00 | -2.80 |
| 6 hours prior | 2026-07-29 09:30 | 400.21 | 403.00 | -2.79 |
| 12 hours prior | 2026-07-29 03:30 | 400.22 | 403.00 | -2.78 |
| 24 hours prior | 2026-07-28 15:30 | 400.24 | 403.00 | -2.76 |
| 48 hours prior | 2026-07-27 15:30 | 400.27 | 403.00 | -2.73 |
*
Data is provisional and subject to revision.
Additional Information
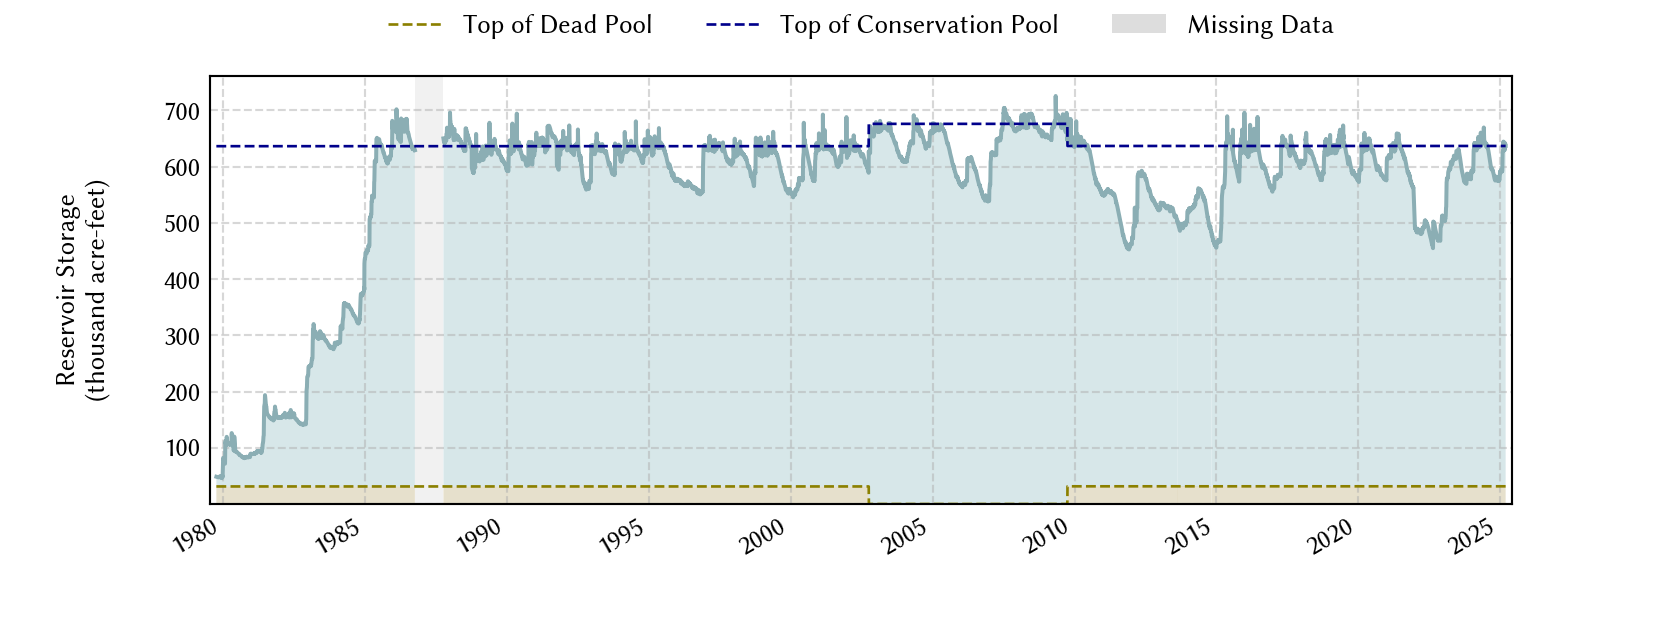
| Impoundment date | 1980-01-01 |
| Vertical datum | NGVD29 |
| Dead pool elevation | 360.00 ft above NGVD29 |
| Top of gate elevation | 405.00 ft above NGVD29 |
| Emergency spillway crest elevation | 385.00 ft above NGVD29 |
| Maximum design elevation | 407.90 ft above NGVD29 |
| Top of dam elevation | 419.50 ft above NGVD29 |
| Conservation pool elevation | 403.00 ft above NGVD29 |
| Data download (CSV) | period of record, last one year, last 30 days |
Elevation-Area-Capacity Curves
1980-02-01 (source: USGS)
2001-03-01 (source: TWDB)
: GIS Data
2009-10-01 (source: TWDB)
: GIS Data
|
|
| Data Source | USGS:08018800 |
| USGS Monitoring Location | USGS:08018800 |
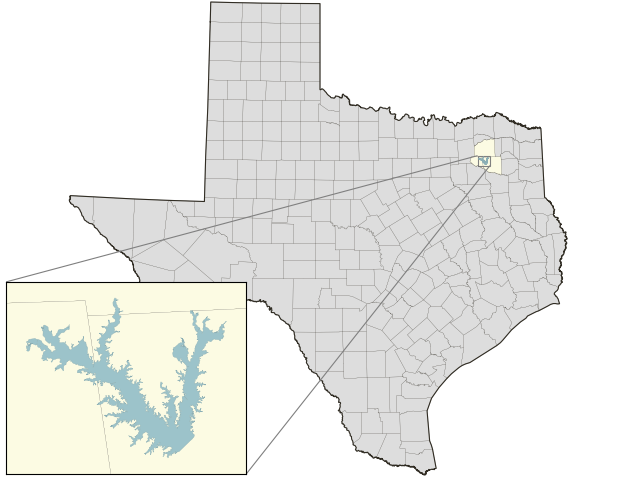
Lake Location