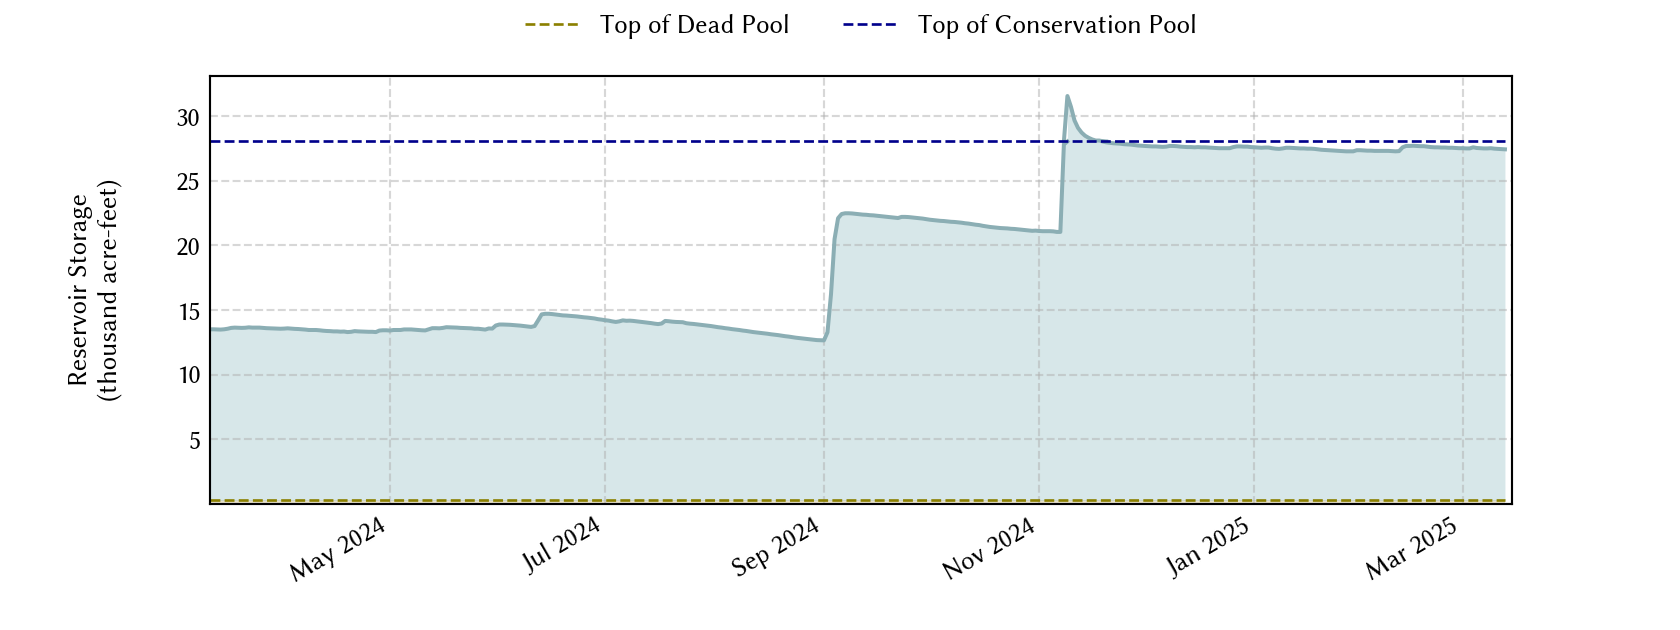
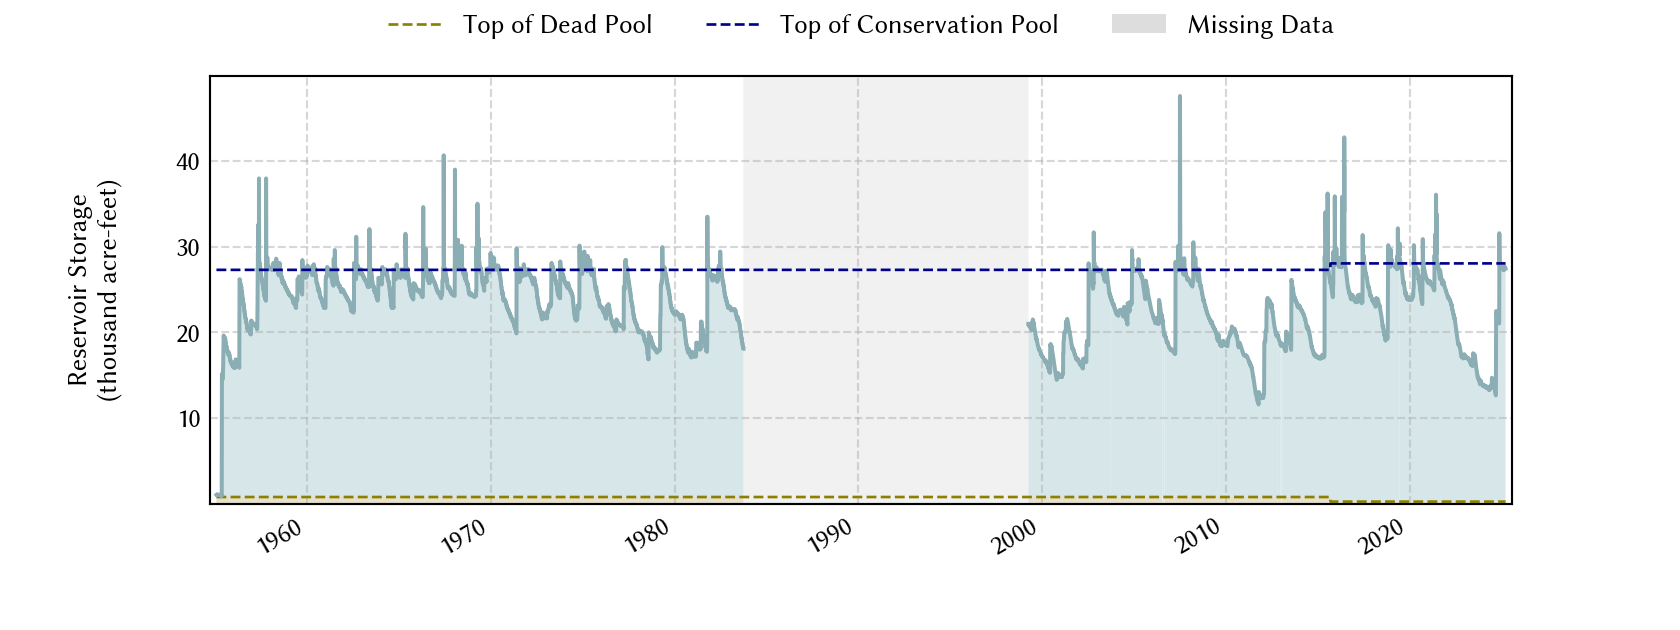
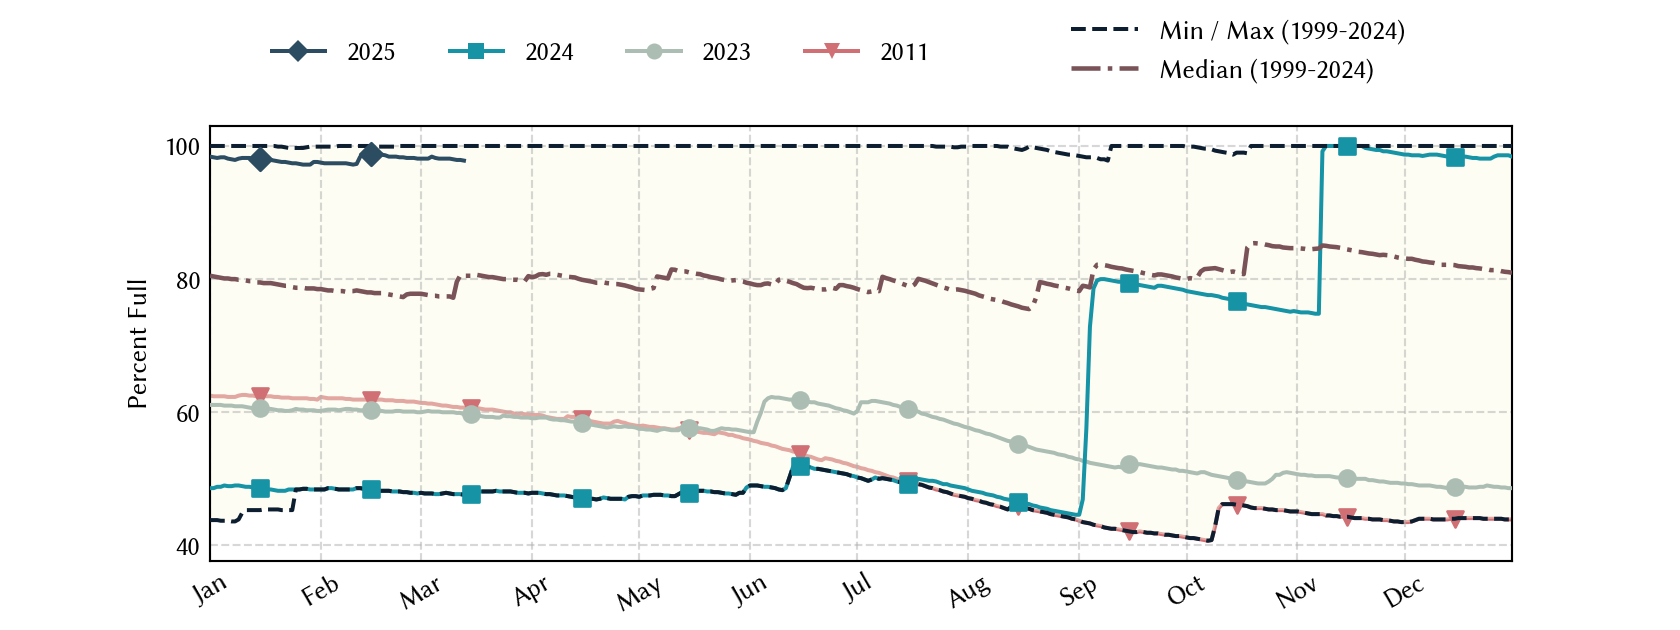
Leon Reservoir: 84.6% full as of 2026-07-30
Historical Data
| Date | Percent Full |
Mean Water Level (ft) |
Reservoir Storage (acre-ft) |
Conservation Storage (acre-ft) |
Conservation Capacity (acre-ft) |
Surface Area (acres) |
|
|---|---|---|---|---|---|---|---|
| Today | 2026-07-30 | 84.6 | 1,372.42 | 23,774 | 23,494 | 27,762 | 1,553 |
| Yesterday | 2026-07-29 | 84.7 | 1,372.44 | 23,805 | 23,525 | 27,762 | 1,555 |
| 2 days ago | 2026-07-28 | 84.9 | 1,372.47 | 23,851 | 23,571 | 27,762 | 1,557 |
| 1 week ago | 2026-07-23 | 85.6 | 1,372.59 | 24,039 | 23,759 | 27,762 | 1,567 |
| 1 month ago | 2026-06-30 | 78.8 | 1,371.35 | 22,163 | 21,883 | 27,762 | 1,470 |
| 3 months ago | 2026-04-30 | 80.8 | 1,371.72 | 22,709 | 22,429 | 27,762 | 1,499 |
| 6 months ago | 2026-01-30 | 82.6 | 1,372.06 | 23,220 | 22,940 | 27,762 | 1,525 |
| 1 year ago | 2025-07-30 | 94.2 | 1,374.07 | 26,443 | 26,163 | 27,762 | 1,683 |
*
Percent Full is based on Conservation Storage and Conservation Capacity and doesn't account for storage in flood pool.
**
Values above, including today's are averaged conditions. For near real-time instantaneous water level, see table below or the interactive map viewer.
Most Recent Instantaneous Water Level
| Date/time |
Water Level (ft) |
Conservation Pool Elevation (ft) |
Height Above Conservation Pool (ft) |
|
|---|---|---|---|---|
| Most recent | 2026-07-30 15:45 | 1,372.40 | 1,375.00 | -2.60 |
| 1 hour prior | 2026-07-30 14:45 | 1,372.42 | 1,375.00 | -2.58 |
| 2 hours prior | 2026-07-30 13:45 | 1,372.41 | 1,375.00 | -2.59 |
| 6 hours prior | 2026-07-30 09:45 | 1,372.42 | 1,375.00 | -2.58 |
| 12 hours prior | 2026-07-30 03:45 | 1,372.42 | 1,375.00 | -2.58 |
| 24 hours prior | 2026-07-29 15:45 | 1,372.44 | 1,375.00 | -2.56 |
| 48 hours prior | 2026-07-28 15:45 | 1,372.46 | 1,375.00 | -2.54 |
*
Data is provisional and subject to revision.
Additional Information
| Impoundment date | 1954-01-01 |
| Vertical datum | NGVD29 |
| Dead pool elevation | 1,335.00 ft above NGVD29 |
| Service spillway crest elevation | 1,375.00 ft above NGVD29 |
| Emergency spillway crest elevation | 1,382.00 ft above NGVD29 |
| Top of dam elevation | 1,398.00 ft above NGVD29 |
| Conservation pool elevation | 1,375.00 ft above NGVD29 |
| Data download (CSV) | period of record, last one year, last 30 days |
| Data Source | USGS:08099000 |
| USGS Monitoring Location | USGS:08099000 |
Lake Location