Lewisville Lake: 96.8% full as of 2026-08-02
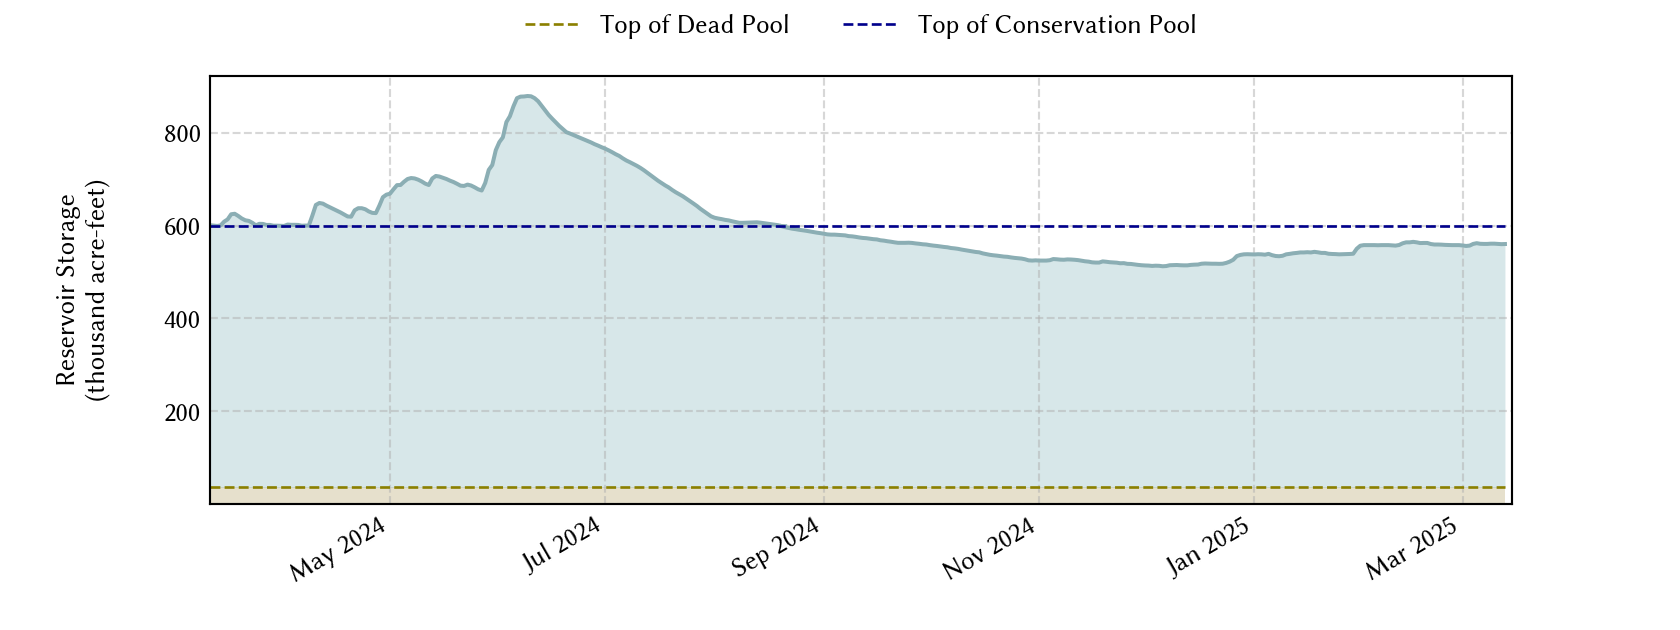
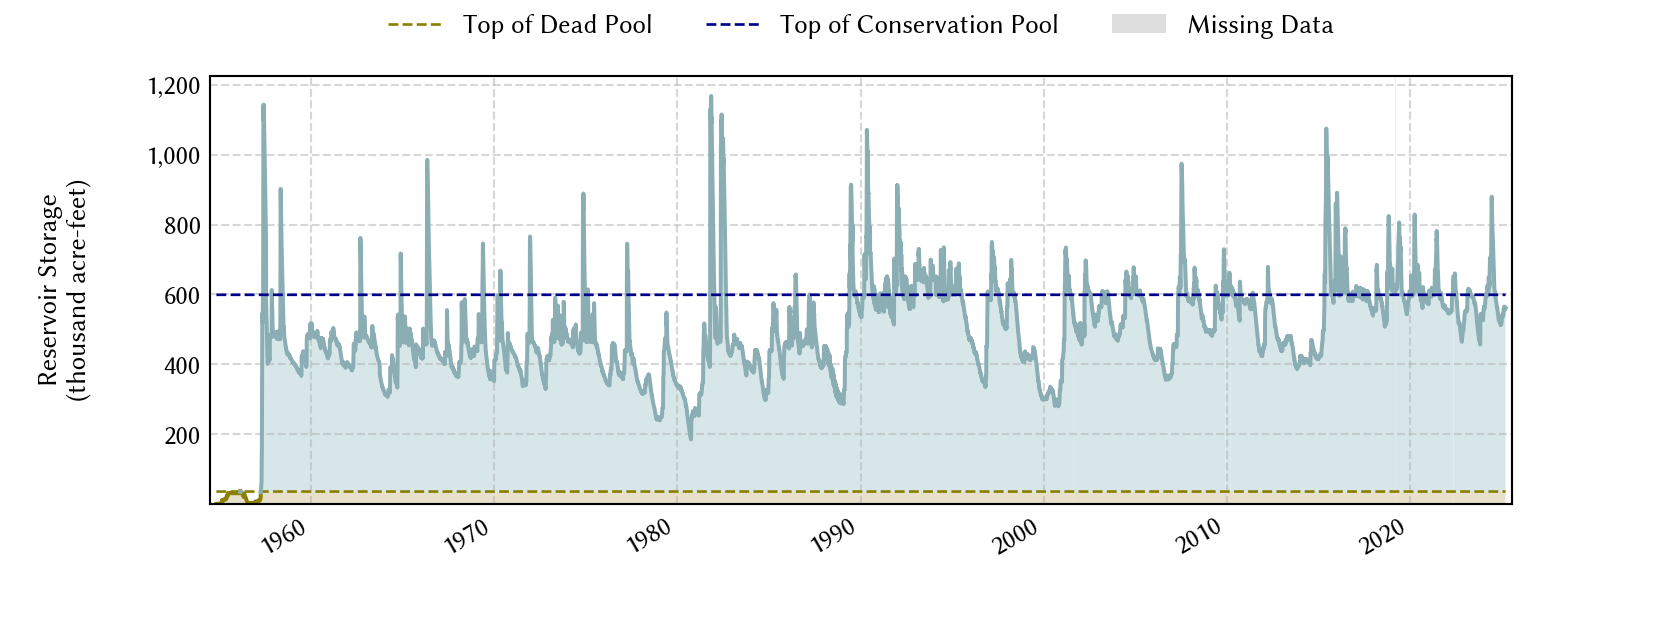
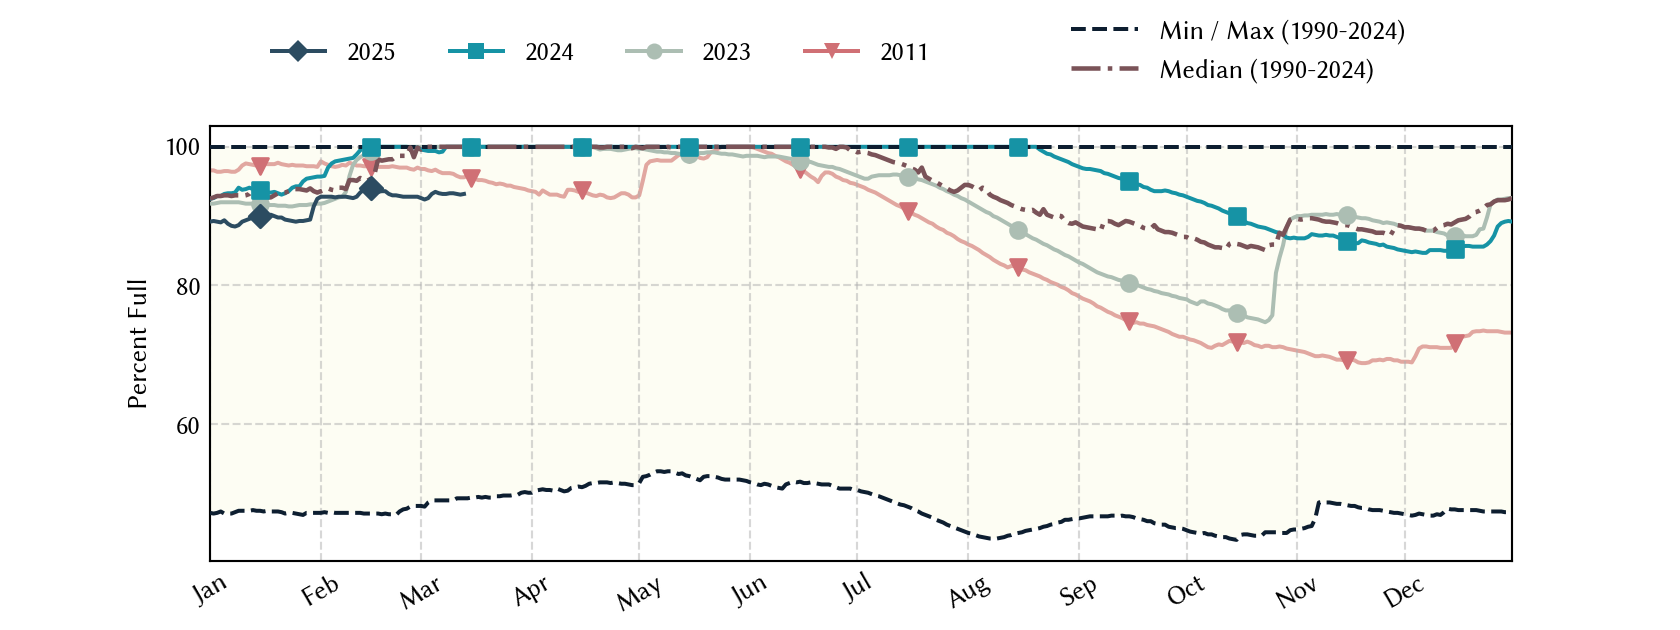
Historical Data
| Date | Percent Full |
Mean Water Level (ft) |
Reservoir Storage (acre-ft) |
Conservation Storage (acre-ft) |
Conservation Capacity (acre-ft) |
Surface Area (acres) |
|
|---|---|---|---|---|---|---|---|
| Today | 2026-08-02 | 96.8 | 521.33 | 580,962 | 545,288 | 563,228 | 26,544 |
| Yesterday | 2026-08-01 | 97.1 | 521.38 | 582,290 | 546,616 | 563,228 | 26,576 |
| 2 days ago | 2026-07-31 | 97.3 | 521.43 | 583,620 | 547,946 | 563,228 | 26,608 |
| 1 week ago | 2026-07-26 | 98.5 | 521.68 | 590,293 | 554,619 | 563,228 | 26,780 |
| 1 month ago | 2026-07-02 | 100.0 | 523.03 | 627,091 | 563,228 | 563,228 | - n.a. - |
| 3 months ago | 2026-05-02 | 100.0 | 522.15 | 602,961 | 563,228 | 563,228 | - n.a. - |
| 6 months ago | 2026-02-02 | 97.4 | 521.45 | 584,152 | 548,478 | 563,228 | 26,621 |
| 1 year ago | 2025-08-02 | 96.8 | 521.32 | 580,696 | 545,022 | 563,228 | 26,538 |
*
Percent Full is based on Conservation Storage and Conservation Capacity and doesn't account for storage in flood pool.
**
Values above, including today's are averaged conditions. For near real-time instantaneous water level, see table below or the interactive map viewer.
Most Recent Instantaneous Water Level
| Date/time |
Water Level (ft) |
Conservation Pool Elevation (ft) |
Height Above Conservation Pool (ft) |
|
|---|---|---|---|---|
| Most recent | 2026-08-02 15:15 | 521.31 | 522.00 | -0.69 |
| 1 hour prior | 2026-08-02 14:15 | 521.30 | 522.00 | -0.70 |
| 2 hours prior | 2026-08-02 13:15 | 521.32 | 522.00 | -0.68 |
| 6 hours prior | 2026-08-02 09:15 | 521.32 | 522.00 | -0.68 |
| 12 hours prior | 2026-08-02 03:15 | 521.34 | 522.00 | -0.66 |
| 24 hours prior | 2026-08-01 15:15 | 521.36 | 522.00 | -0.64 |
| 48 hours prior | 2026-07-31 15:15 | 521.42 | 522.00 | -0.58 |
*
Data is provisional and subject to revision.
Additional Information
| Impoundment date | 1955-01-01 |
| Vertical datum | NGVD29 |
| Dead pool elevation | 481.00 ft above NGVD29 |
| Emergency spillway crest elevation | 532.00 ft above NGVD29 |
| Flood pool elevation | 532.00 ft above NGVD29 |
| Maximum design elevation | 552.14 ft above NGVD29 |
| Maximum design elevation | 553.00 ft above NGVD29 |
| Top of dam elevation | 560.00 ft above NGVD29 |
| Conservation pool elevation | 522.00 ft above NGVD29 |
| Data download (CSV) | period of record, last one year, last 30 days |
Elevation-Area-Capacity Curves
2007-09-01 (source: TWDB)
: GIS Data
|
|
| Data Source | USGS:08052800 |
| USGS Monitoring Location | USGS:08052800 |
Lake Location