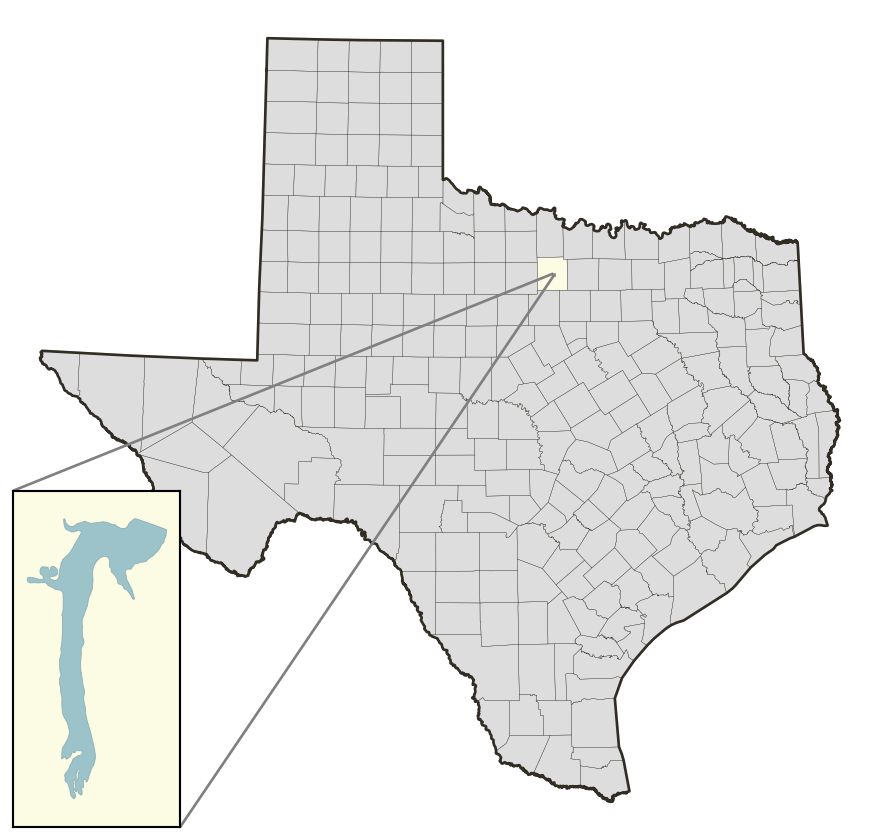
Lost Creek Reservoir: 92.6% full as of 2026-07-30
Historical Data
| Date | Percent Full |
Mean Water Level (ft) |
Reservoir Storage (acre-ft) |
Conservation Storage (acre-ft) |
Conservation Capacity (acre-ft) |
Surface Area (acres) |
|
|---|---|---|---|---|---|---|---|
| Today | 2026-07-30 | 92.6 | 1,007.25 | 11,070 | 11,070 | 11,950 | - n.a. - |
| Yesterday | 2026-07-29 | 92.7 | 1,007.27 | 11,077 | 11,077 | 11,950 | - n.a. - |
| 2 days ago | 2026-07-28 | 92.8 | 1,007.30 | 11,087 | 11,087 | 11,950 | - n.a. - |
| 1 week ago | 2026-07-23 | 93.3 | 1,007.47 | 11,144 | 11,144 | 11,950 | - n.a. - |
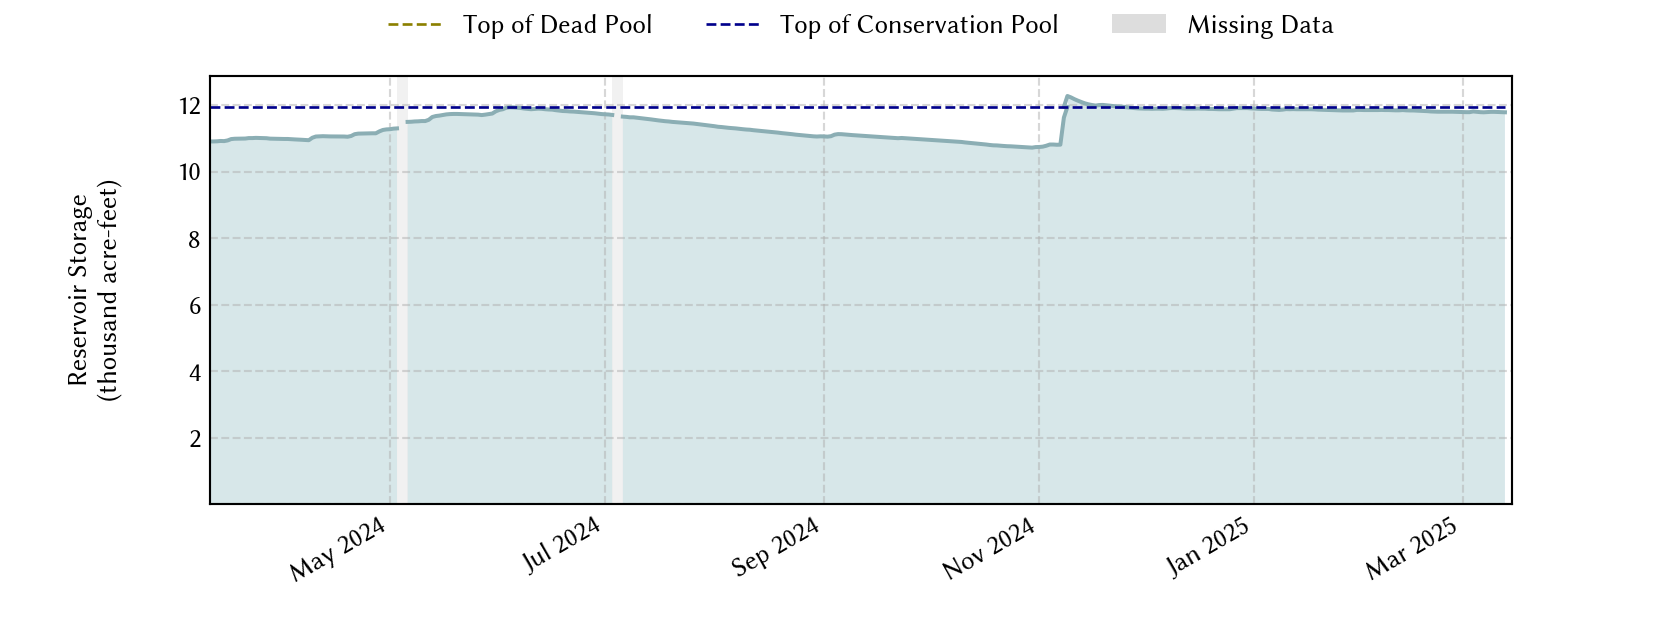
| 1 month ago | 2026-06-30 | 94.9 | 1,008.04 | 11,338 | 11,338 | 11,950 | - n.a. - |
| 3 months ago | 2026-04-30 | 95.5 | 1,008.21 | 11,409 | 11,409 | 11,950 | - n.a. - |
| 6 months ago | 2026-01-30 | 93.6 | 1,007.58 | 11,180 | 11,180 | 11,950 | - n.a. - |
| 1 year ago | 2025-07-30 | 96.5 | 1,008.50 | 11,530 | 11,530 | 11,950 | - n.a. - |
*
Percent Full is based on Conservation Storage and Conservation Capacity and doesn't account for storage in flood pool.
**
Values above, including today's are averaged conditions. For near real-time instantaneous water level, see table below or the interactive map viewer.
Most Recent Instantaneous Water Level
| Date/time |
Water Level (ft) |
Conservation Pool Elevation (ft) |
Height Above Conservation Pool (ft) |
|
|---|---|---|---|---|
| Most recent | 2026-07-30 15:15 | 1,007.24 | 1,009.50 | -2.26 |
| 1 hour prior | 2026-07-30 14:15 | 1,007.24 | 1,009.50 | -2.26 |
| 2 hours prior | 2026-07-30 13:15 | 1,007.25 | 1,009.50 | -2.25 |
| 6 hours prior | 2026-07-30 09:15 | 1,007.25 | 1,009.50 | -2.25 |
| 12 hours prior | 2026-07-30 03:15 | 1,007.25 | 1,009.50 | -2.25 |
| 24 hours prior | 2026-07-29 15:15 | 1,007.27 | 1,009.50 | -2.23 |
| 48 hours prior | 2026-07-28 15:15 | 1,007.30 | 1,009.50 | -2.20 |
*
Data is provisional and subject to revision.
Additional Information
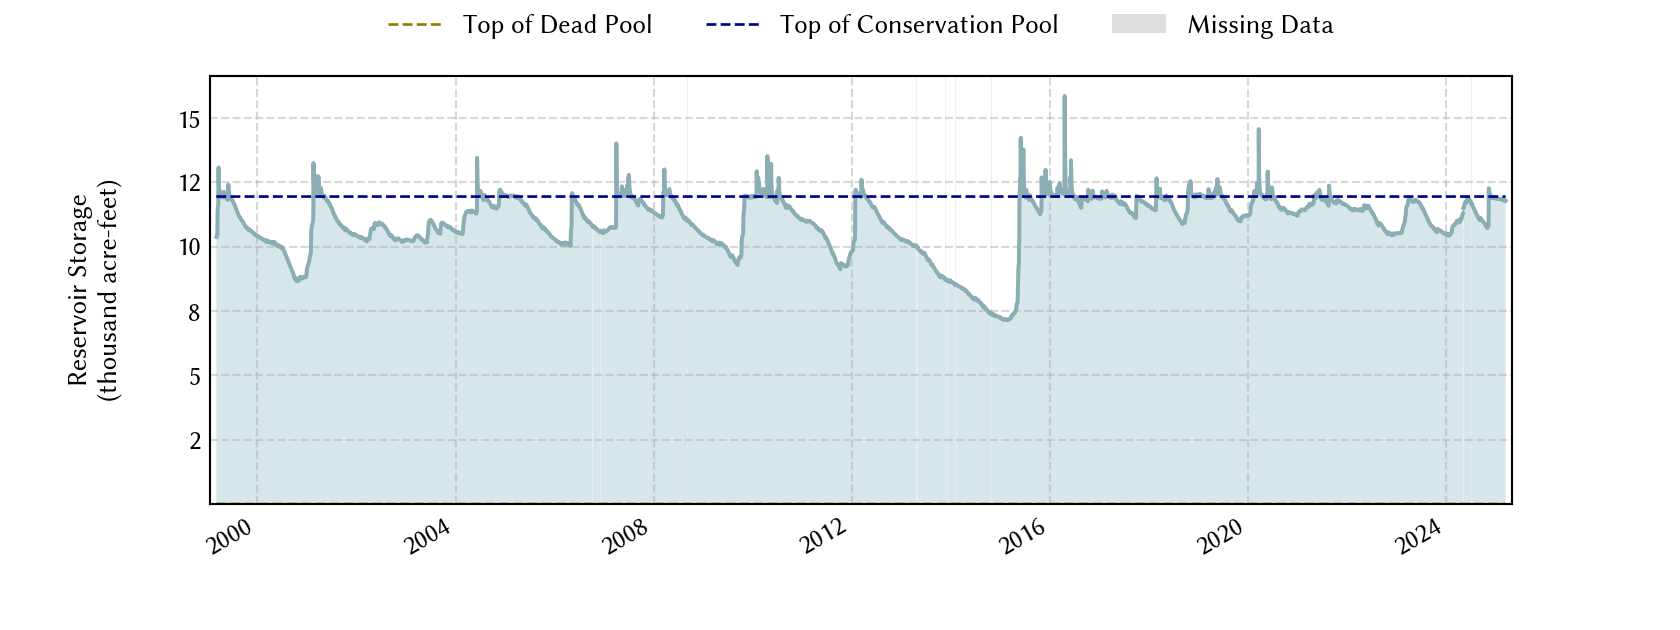
| Impoundment date | 1991-01-01 |
| Vertical datum | NGVD29 |
| Top of dam elevation | 1,028.90 ft above NGVD29 |
| Conservation pool elevation | 1,009.50 ft above NGVD29 |
| Data download (CSV) | period of record, last one year, last 30 days |
Elevation-Area-Capacity Curves |
|
| Data Source | USGS:08042820 |
| USGS Monitoring Location | USGS:08042820 |
Lake Location