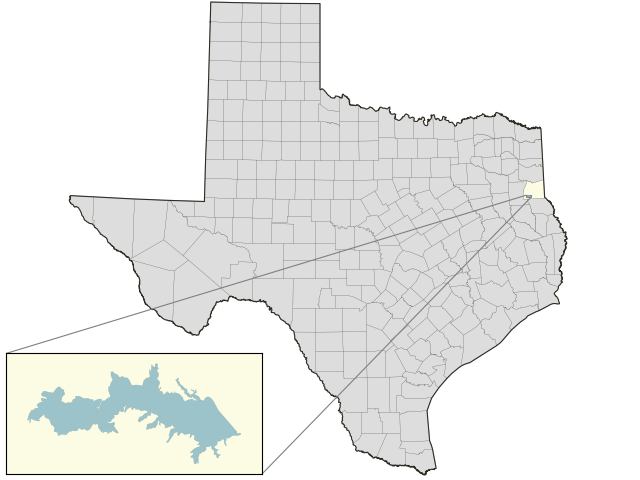
Murvaul Lake: 96.9% full as of 2026-07-30
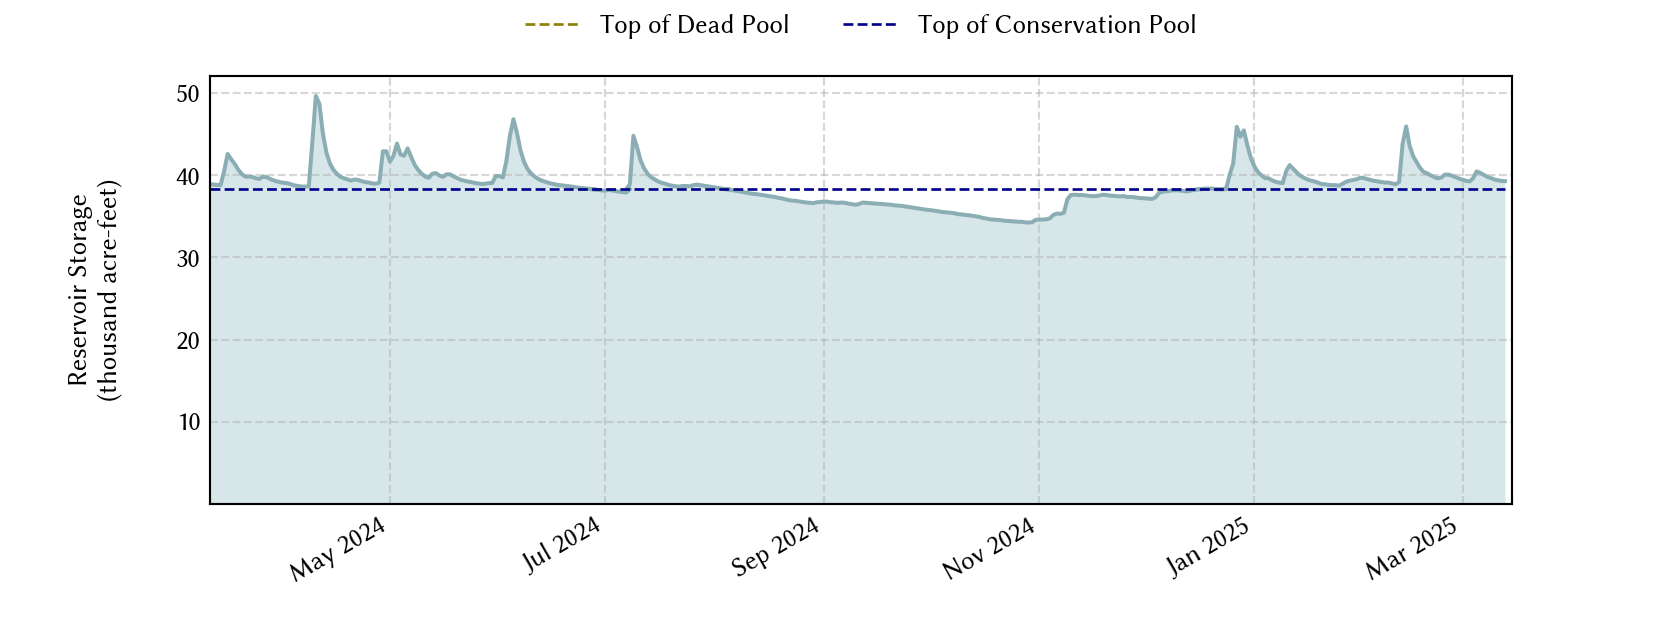
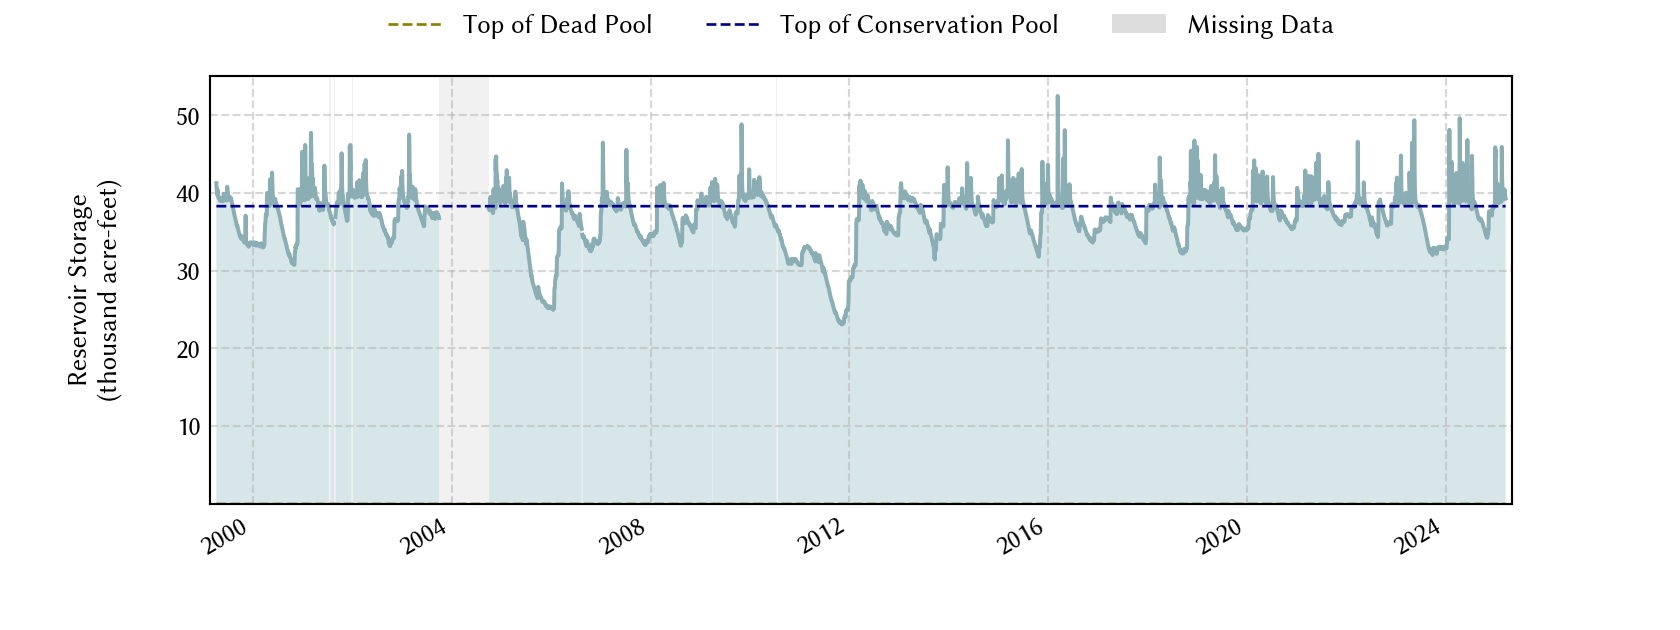
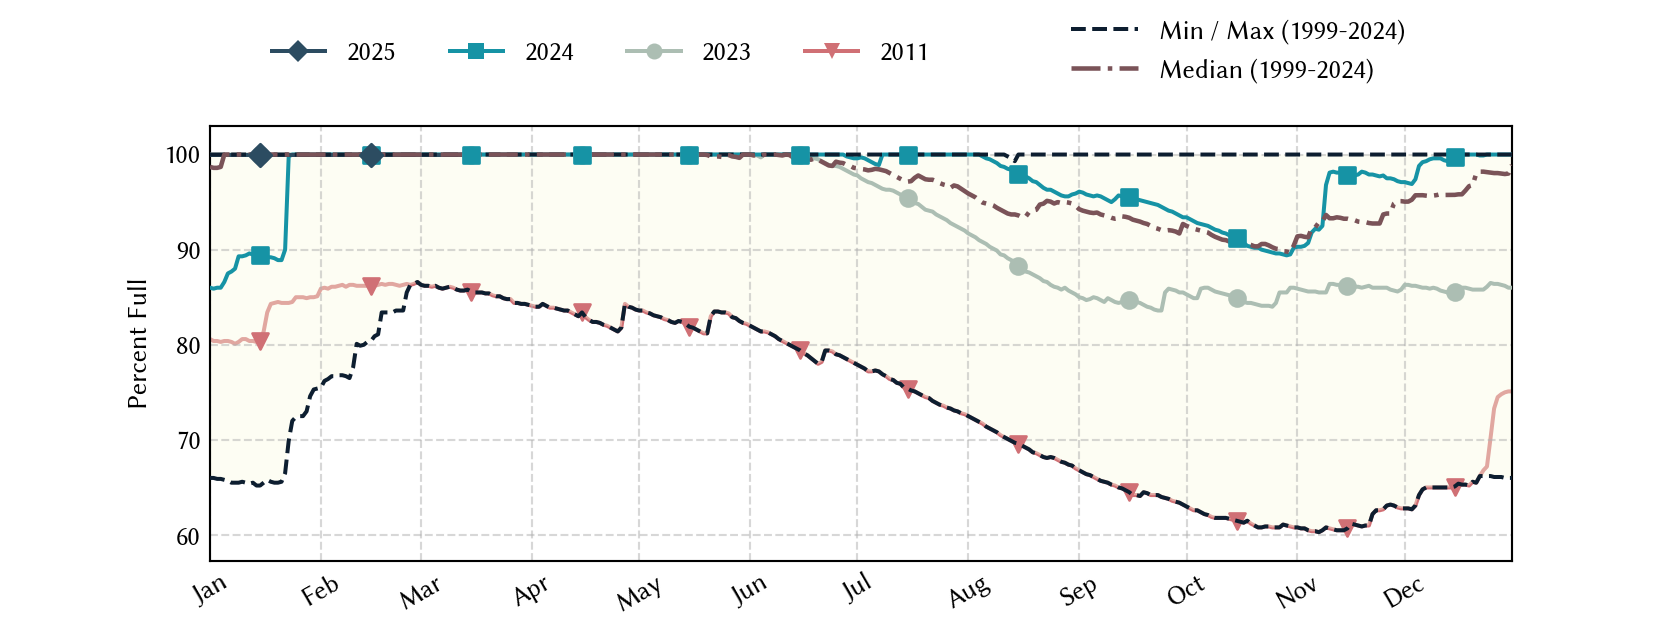
Historical Data
| Date | Percent Full |
Mean Water Level (ft) |
Reservoir Storage (acre-ft) |
Conservation Storage (acre-ft) |
Conservation Capacity (acre-ft) |
Surface Area (acres) |
|
|---|---|---|---|---|---|---|---|
| Today | 2026-07-30 | 96.9 | 264.95 | 37,091 | 37,091 | 38,285 | 3,391 |
| Yesterday | 2026-07-29 | 97.1 | 264.97 | 37,158 | 37,158 | 38,285 | 3,393 |
| 2 days ago | 2026-07-28 | 97.2 | 264.99 | 37,226 | 37,226 | 38,285 | 3,396 |
| 1 week ago | 2026-07-23 | 98.2 | 265.10 | 37,601 | 37,601 | 38,285 | 3,409 |
| 1 month ago | 2026-06-30 | 100.0 | 265.30 | 38,285 | 38,285 | 38,285 | 3,507 |
| 3 months ago | 2026-04-30 | 100.0 | 265.33 | 38,388 | 38,285 | 38,285 | - n.a. - |
| 6 months ago | 2026-01-30 | 98.3 | 265.11 | 37,635 | 37,635 | 38,285 | 3,410 |
| 1 year ago | 2025-07-30 | 97.2 | 264.99 | 37,226 | 37,226 | 38,285 | 3,396 |
*
Percent Full is based on Conservation Storage and Conservation Capacity and doesn't account for storage in flood pool.
**
Values above, including today's are averaged conditions. For near real-time instantaneous water level, see table below or the interactive map viewer.
Most Recent Instantaneous Water Level
| Date/time |
Water Level (ft) |
Conservation Pool Elevation (ft) |
Height Above Conservation Pool (ft) |
|
|---|---|---|---|---|
| Most recent | 2026-07-30 15:00 | 264.94 | 265.30 | -0.36 |
| 1 hour prior | 2026-07-30 14:00 | 264.94 | 265.30 | -0.36 |
| 2 hours prior | 2026-07-30 13:00 | 264.94 | 265.30 | -0.36 |
| 6 hours prior | 2026-07-30 09:00 | 264.95 | 265.30 | -0.35 |
| 12 hours prior | 2026-07-30 03:00 | 264.95 | 265.30 | -0.35 |
| 24 hours prior | 2026-07-29 15:00 | 264.97 | 265.30 | -0.33 |
| 48 hours prior | 2026-07-28 15:00 | 264.98 | 265.30 | -0.32 |
*
Data is provisional and subject to revision.
Additional Information
| Impoundment date | 1958-01-01 |
| Vertical datum | NGVD29 |
| Dead pool elevation | 235.00 ft above NGVD29 |
| Service spillway crest elevation | 265.30 ft above NGVD29 |
| Top of dam elevation | 280.00 ft above NGVD29 |
| Conservation pool elevation | 265.30 ft above NGVD29 |
| Data download (CSV) | period of record, last one year, last 30 days |
| Data Source | USGS:08022200 |
| USGS Monitoring Location | USGS:08022200 |
Lake Location