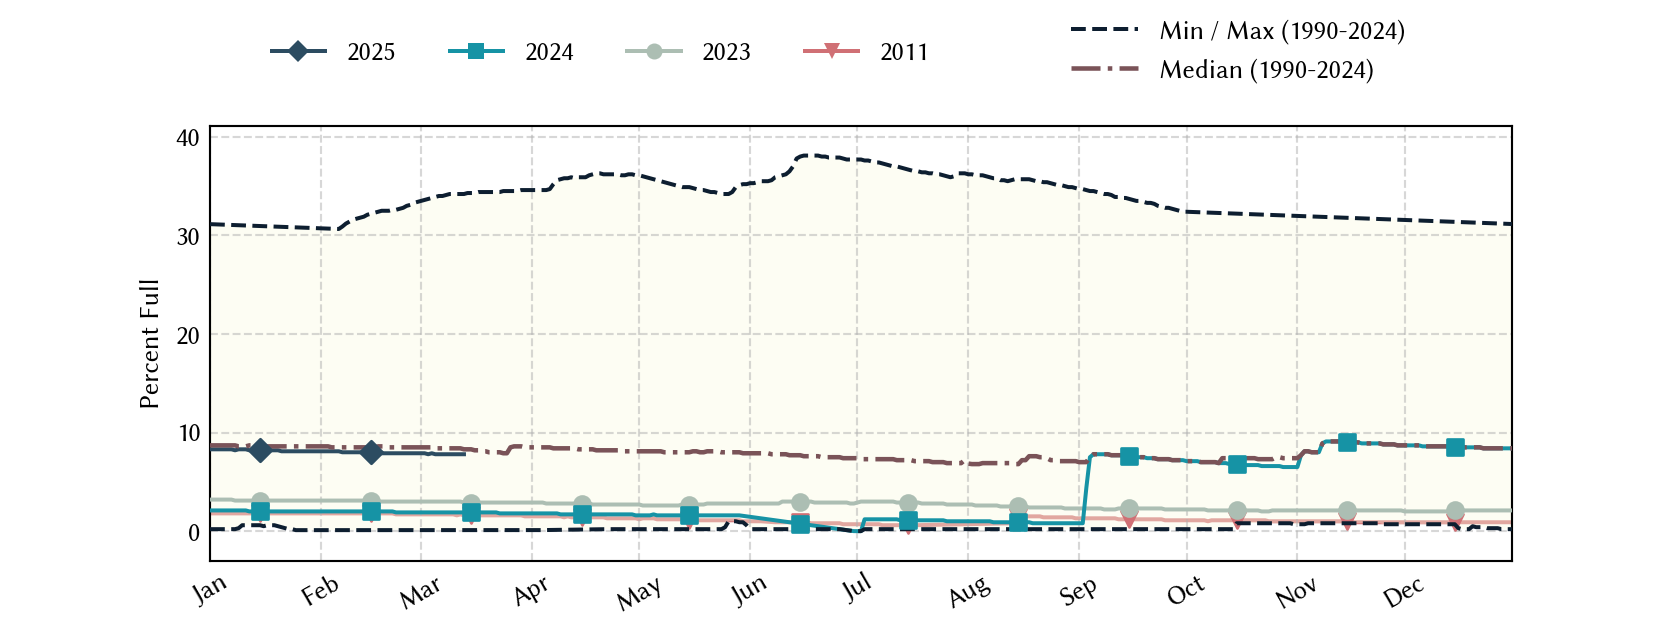
O. C. Fisher Lake: 12.6% full as of 2026-07-30
Historical Data
| Date | Percent Full |
Mean Water Level (ft) |
Reservoir Storage (acre-ft) |
Conservation Storage (acre-ft) |
Conservation Capacity (acre-ft) |
Surface Area (acres) |
|
|---|---|---|---|---|---|---|---|
| Today | 2026-07-30 | 12.6 | 1,874.01 | 14,570 | 14,569 | 115,742 | 1,228 |
| Yesterday | 2026-07-29 | 12.6 | 1,874.03 | 14,595 | 14,594 | 115,742 | 1,229 |
| 2 days ago | 2026-07-28 | 12.6 | 1,874.06 | 14,633 | 14,632 | 115,742 | 1,232 |
| 1 week ago | 2026-07-23 | 12.8 | 1,874.21 | 14,823 | 14,822 | 115,742 | 1,244 |
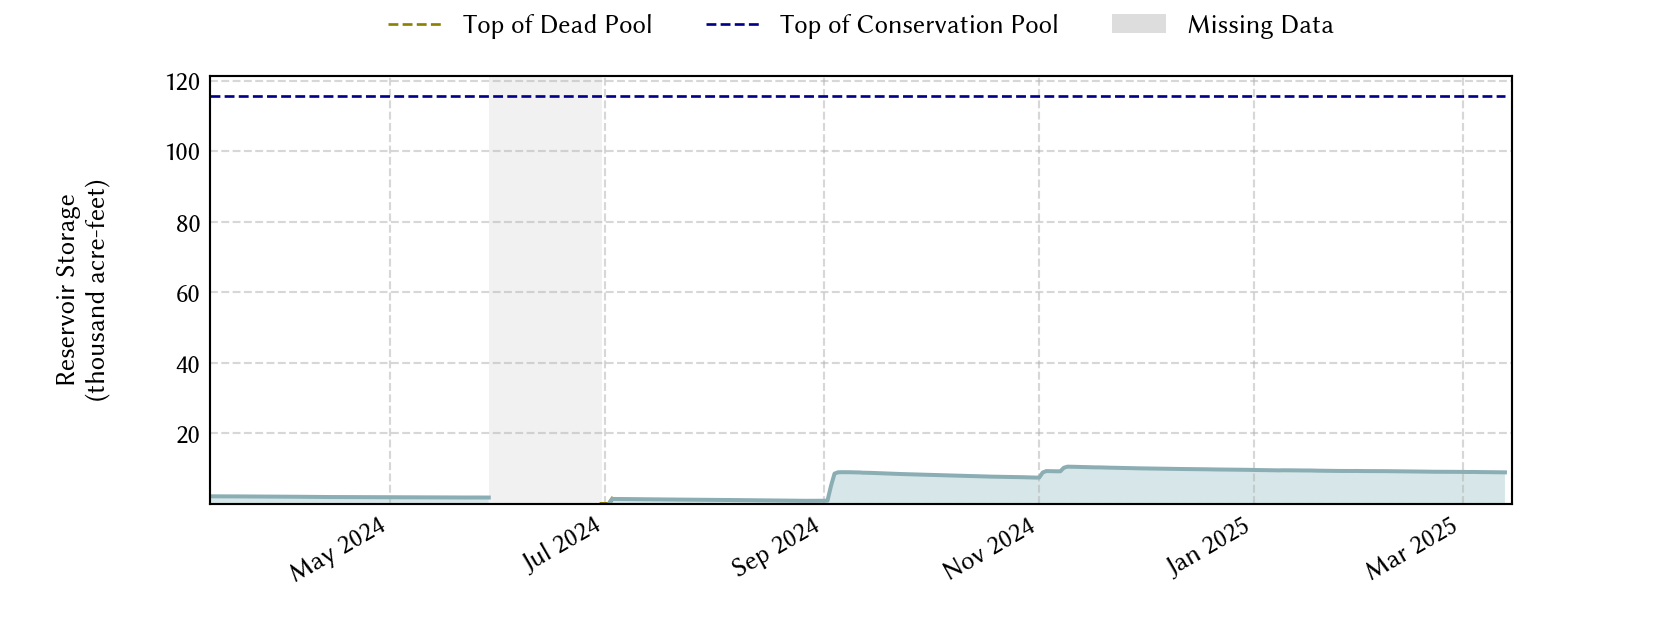
| 1 month ago | 2026-06-30 | 13.2 | 1,874.57 | 15,280 | 15,279 | 115,742 | 1,274 |
| 3 months ago | 2026-04-30 | 14.2 | 1,875.42 | 16,383 | 16,382 | 115,742 | 1,326 |
| 6 months ago | 2026-01-30 | 14.8 | 1,875.97 | 17,114 | 17,113 | 115,742 | 1,347 |
| 1 year ago | 2025-07-30 | 18.3 | 1,878.63 | 21,134 | 21,133 | 115,742 | 1,693 |
*
Percent Full is based on Conservation Storage and Conservation Capacity and doesn't account for storage in flood pool.
**
Values above, including today's are averaged conditions. For near real-time instantaneous water level, see table below or the interactive map viewer.
Most Recent Instantaneous Water Level
| Date/time |
Water Level (ft) |
Conservation Pool Elevation (ft) |
Height Above Conservation Pool (ft) |
|
|---|---|---|---|---|
| Most recent | 2026-07-30 16:00 | 1,874.01 | 1,908.00 | -33.99 |
| 1 hour prior | 2026-07-30 15:00 | 1,874.00 | 1,908.00 | -34.00 |
| 2 hours prior | 2026-07-30 14:00 | 1,874.00 | 1,908.00 | -34.00 |
| 6 hours prior | 2026-07-30 10:00 | 1,874.01 | 1,908.00 | -33.99 |
| 12 hours prior | 2026-07-30 04:00 | 1,874.01 | 1,908.00 | -33.99 |
| 24 hours prior | 2026-07-29 16:00 | 1,874.03 | 1,908.00 | -33.97 |
| 48 hours prior | 2026-07-28 16:00 | 1,874.06 | 1,908.00 | -33.94 |
*
Data is provisional and subject to revision.
Additional Information
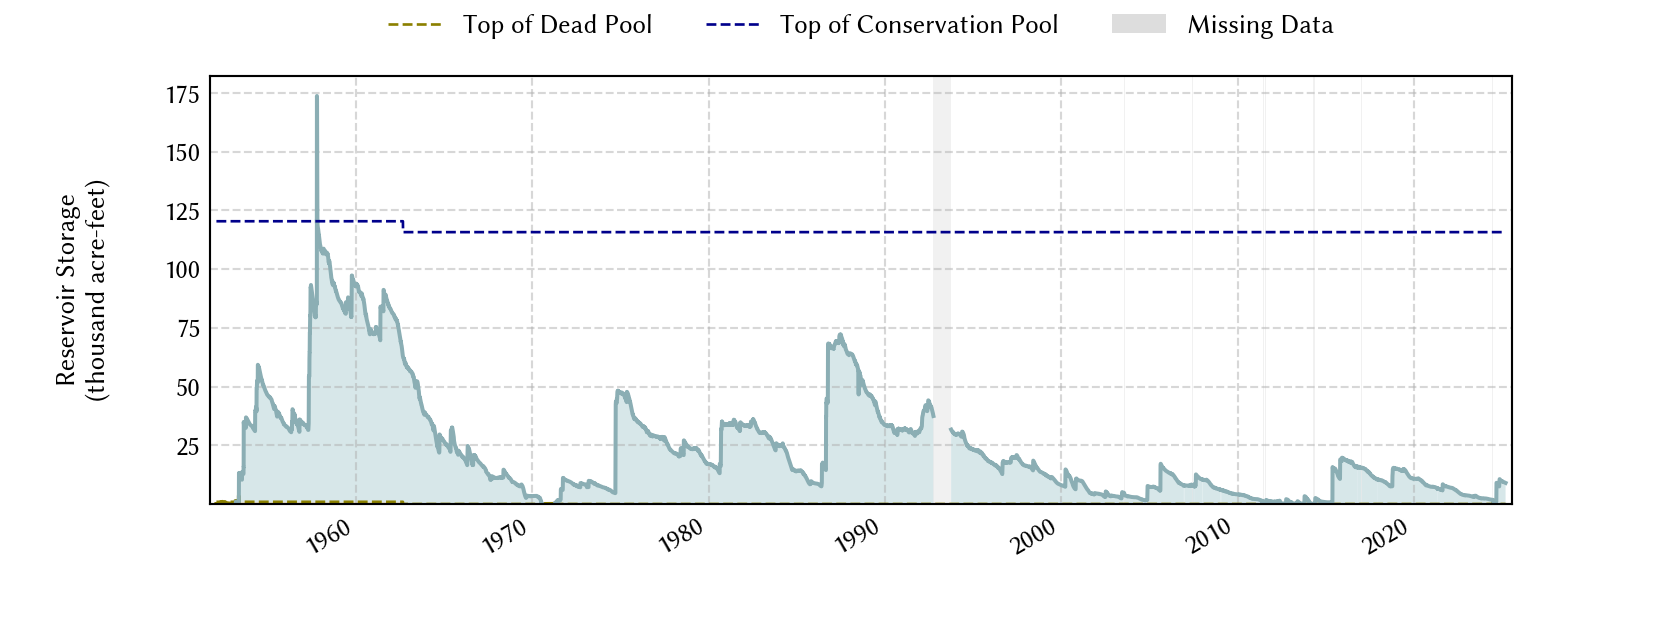
| Impoundment date | 1951-01-01 |
| Vertical datum | NGVD29 |
| Dead pool elevation | 1,840.00 ft above NGVD29 |
| Emergency spillway crest elevation | 1,938.50 ft above NGVD29 |
| Flood pool elevation | 1,938.50 ft above NGVD29 |
| Maximum design elevation | 1,958.00 ft above NGVD29 |
| Top of dam elevation | 1,964.00 ft above NGVD29 |
| Conservation pool elevation | 1,908.00 ft above NGVD29 |
| Data download (CSV) | period of record, last one year, last 30 days |
Elevation-Area-Capacity Curves
1959-02-01 (source: TWDB)
1962-09-01 (source: USACE)
2003-08-01 (source: USACE)
|
|
| Data Source | USGS:08134500 |
| USGS Monitoring Location | USGS:08134500 |
Lake Location