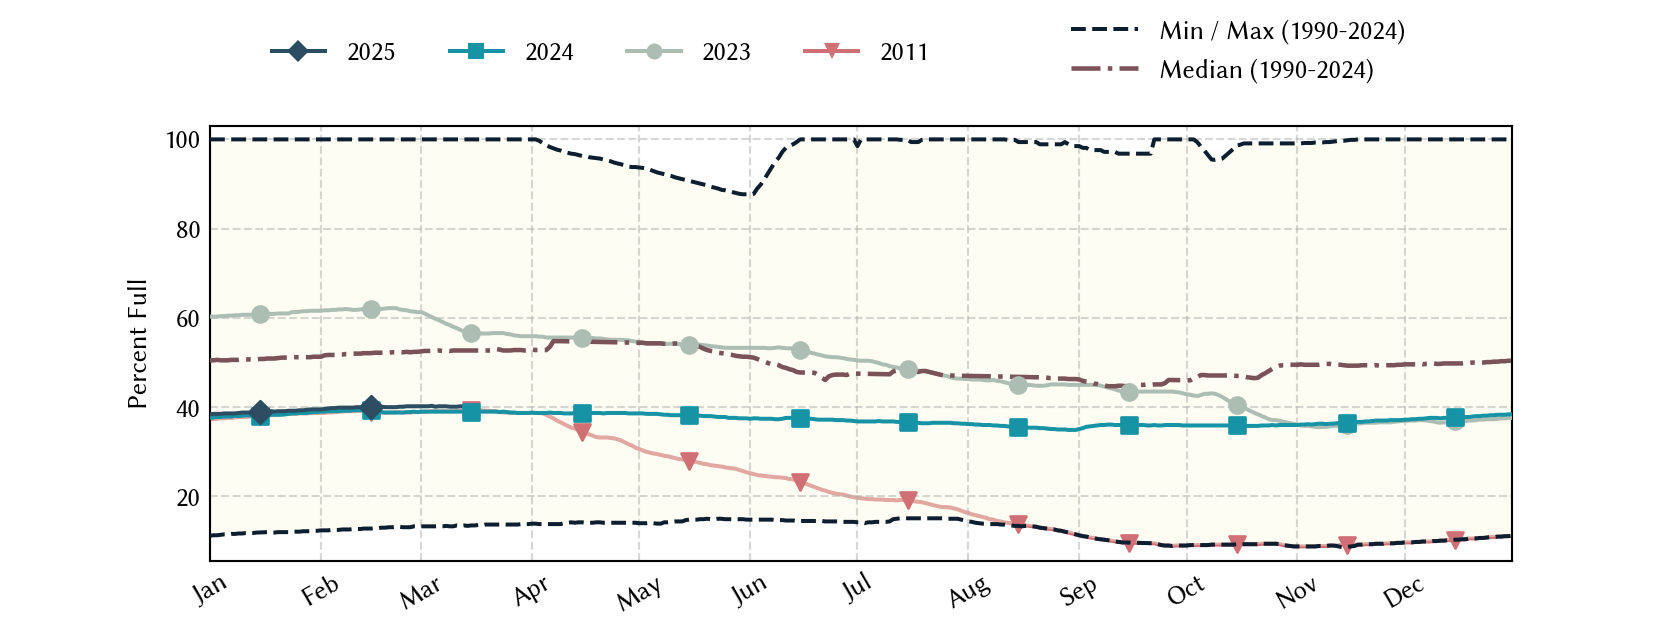
Red Bluff Reservoir: 48.2% full as of 2026-07-30
Historical Data
| Date | Percent Full |
Mean Water Level (ft) |
Reservoir Storage (acre-ft) |
Conservation Storage (acre-ft) |
Conservation Capacity (acre-ft) |
Surface Area (acres) |
|
|---|---|---|---|---|---|---|---|
| Today | 2026-07-30 | 48.2 | 2,815.54 | 70,007 | 70,007 | 145,165 | 4,688 |
| Yesterday | 2026-07-29 | 48.3 | 2,815.56 | 70,104 | 70,104 | 145,165 | 4,692 |
| 2 days ago | 2026-07-28 | 48.3 | 2,815.57 | 70,152 | 70,152 | 145,165 | 4,694 |
| 1 week ago | 2026-07-23 | 48.5 | 2,815.63 | 70,442 | 70,442 | 145,165 | 4,706 |
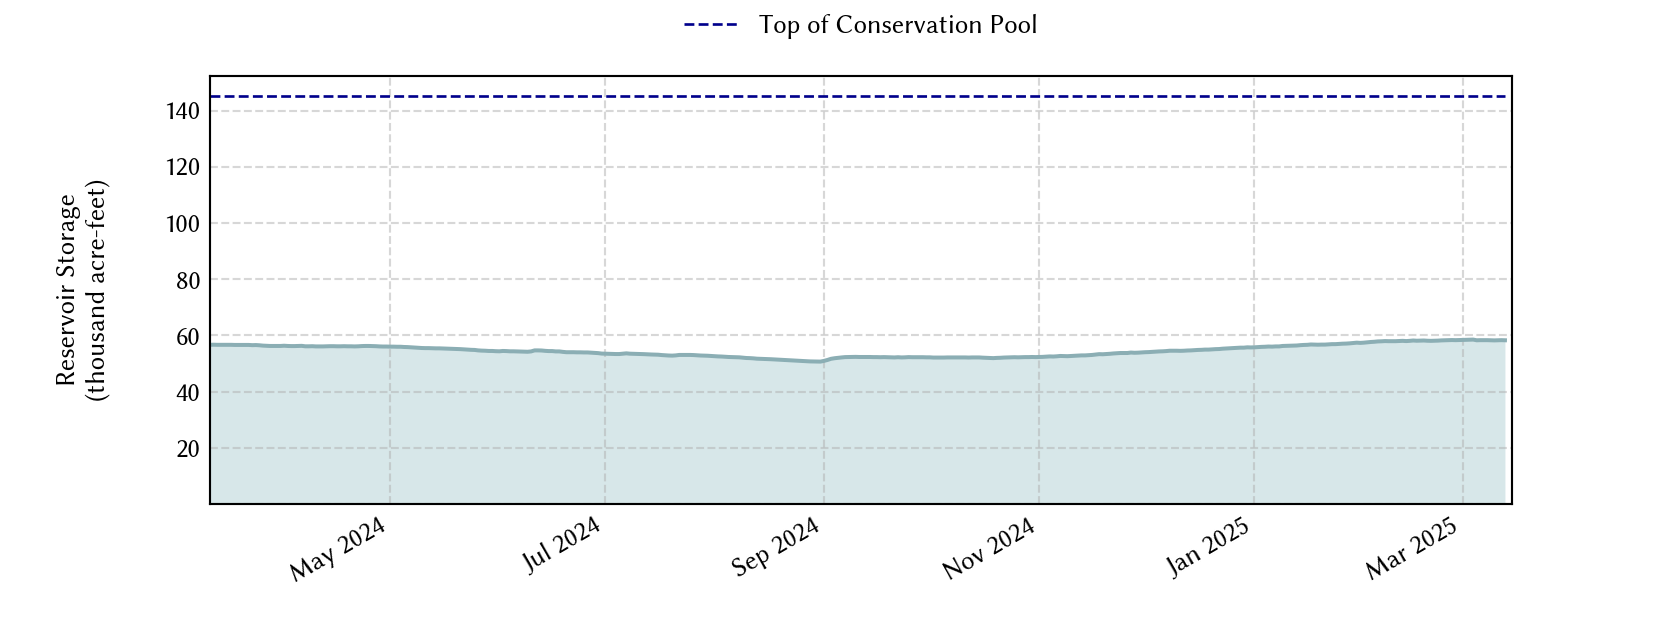
| 1 month ago | 2026-06-30 | 49.8 | 2,816.00 | 72,228 | 72,228 | 145,165 | 4,780 |
| 3 months ago | 2026-04-30 | 53.7 | 2,817.18 | 77,926 | 77,926 | 145,165 | 5,015 |
| 6 months ago | 2026-01-30 | 55.1 | 2,817.58 | 79,992 | 79,992 | 145,165 | 5,093 |
| 1 year ago | 2025-07-30 | 50.3 | 2,816.15 | 72,953 | 72,953 | 145,165 | 4,810 |
*
Percent Full is based on Conservation Storage and Conservation Capacity and doesn't account for storage in flood pool.
**
Values above, including today's are averaged conditions. For near real-time instantaneous water level, see table below or the interactive map viewer.
Most Recent Instantaneous Water Level
| Date/time |
Water Level (ft) |
Conservation Pool Elevation (ft) |
Height Above Conservation Pool (ft) |
|
|---|---|---|---|---|
| Most recent | 2026-07-30 15:15 | 2,815.56 | 2,828.10 | -12.54 |
| 1 hour prior | 2026-07-30 14:15 | 2,815.56 | 2,828.10 | -12.54 |
| 2 hours prior | 2026-07-30 13:15 | 2,815.56 | 2,828.10 | -12.54 |
| 6 hours prior | 2026-07-30 09:15 | 2,815.53 | 2,828.10 | -12.57 |
| 12 hours prior | 2026-07-30 03:15 | 2,815.54 | 2,828.10 | -12.56 |
| 24 hours prior | 2026-07-29 15:15 | 2,815.57 | 2,828.10 | -12.53 |
| 48 hours prior | 2026-07-28 15:15 | 2,815.58 | 2,828.10 | -12.52 |
*
Data is provisional and subject to revision.
Additional Information
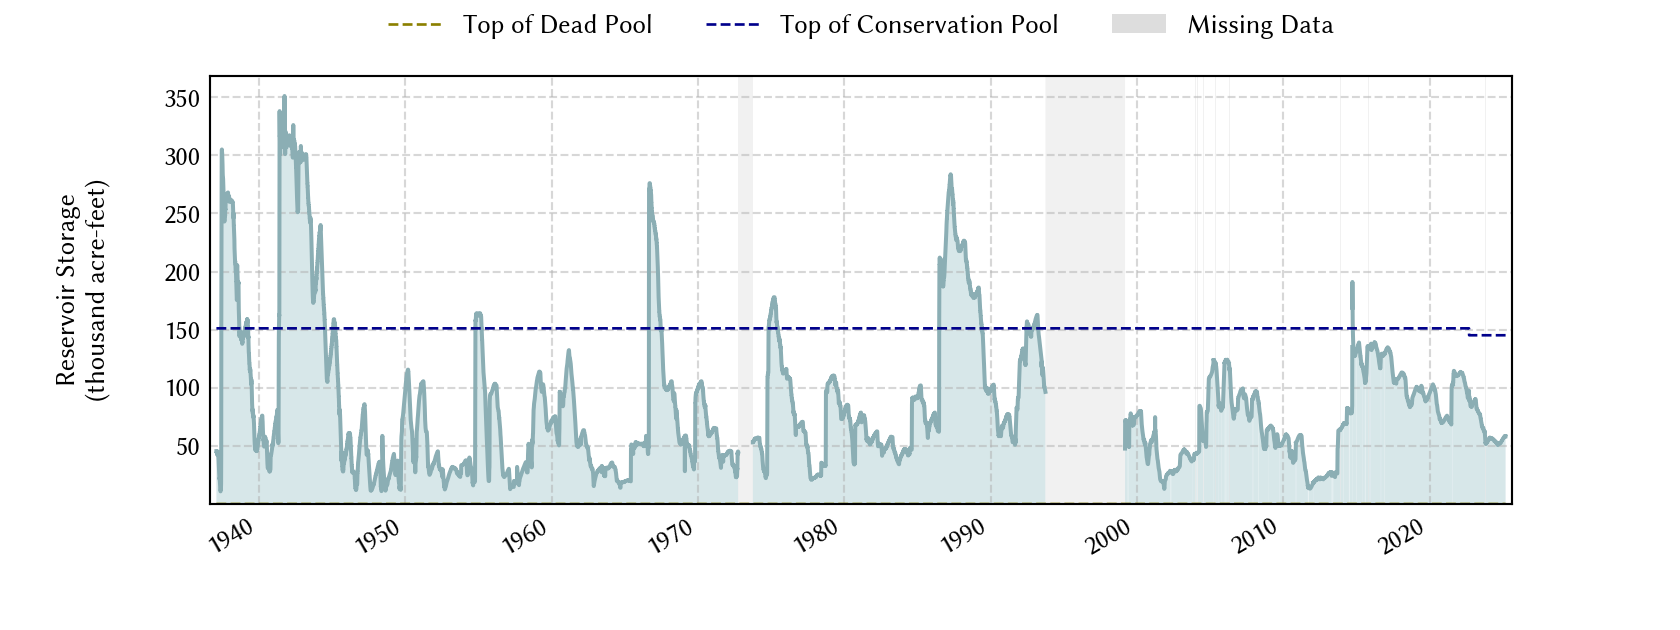
| Impoundment date | 1936-01-01 |
|
Vertical datum
|
NAVD88 |
|
Vertical datum
|
NGVD29 |
|
Service spillway crest elevation |
2,828.10 ft above NAVD88 |
|
Service spillway crest elevation |
2,827.40 ft above NGVD29 |
|
Top of gate elevation |
2,843.10 ft above NAVD88 |
|
Top of gate elevation |
2,842.40 ft above NGVD29 |
|
Emergency spillway crest elevation |
2,846.10 ft above NAVD88 |
|
Emergency spillway crest elevation |
2,845.40 ft above NGVD29 |
|
Top of dam elevation |
2,857.10 ft above NAVD88 |
|
Top of dam elevation |
2,856.40 ft above NGVD29 |
|
Conservation pool elevation |
2,828.10 ft above NAVD88 |
|
Conservation pool elevation |
2,827.40 ft above NGVD29 |
| Data download (CSV) | period of record, last one year, last 30 days |
Elevation-Area-Capacity Curves
2011-11-01 (source: TWDB)
: GIS Data
|
|
| Data Source | USGS:08410000 |
| USGS Monitoring Location | USGS:08410000 |
Lake Location