Sam Rayburn Reservoir: 63.2% full as of 2026-10-12
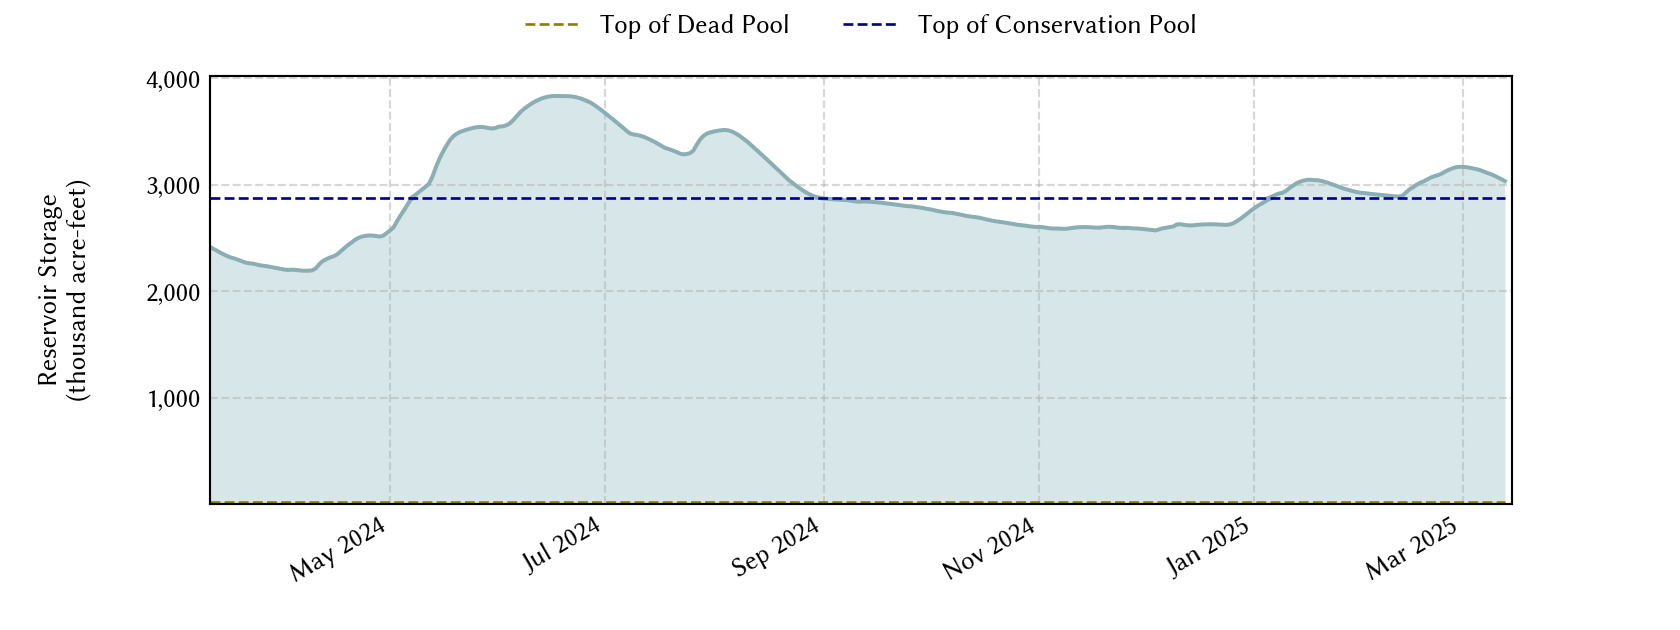
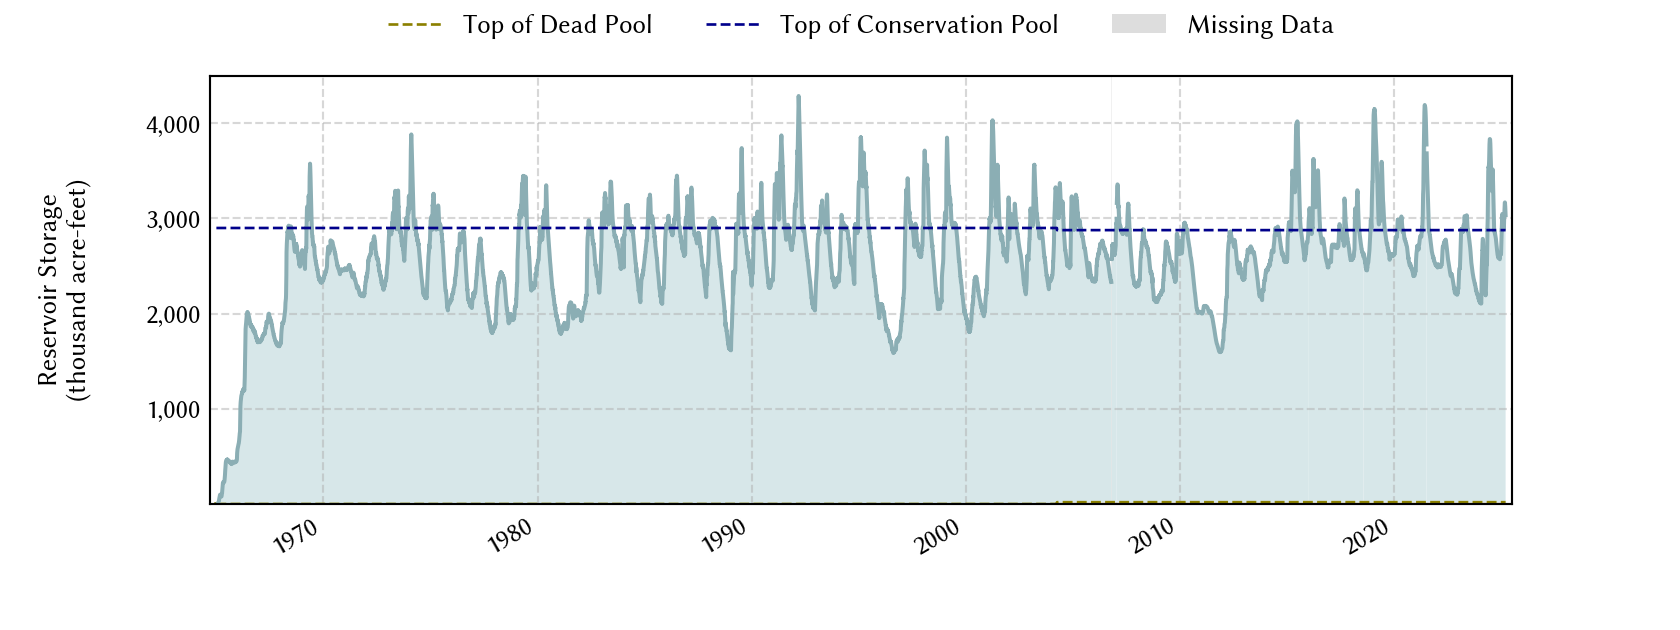
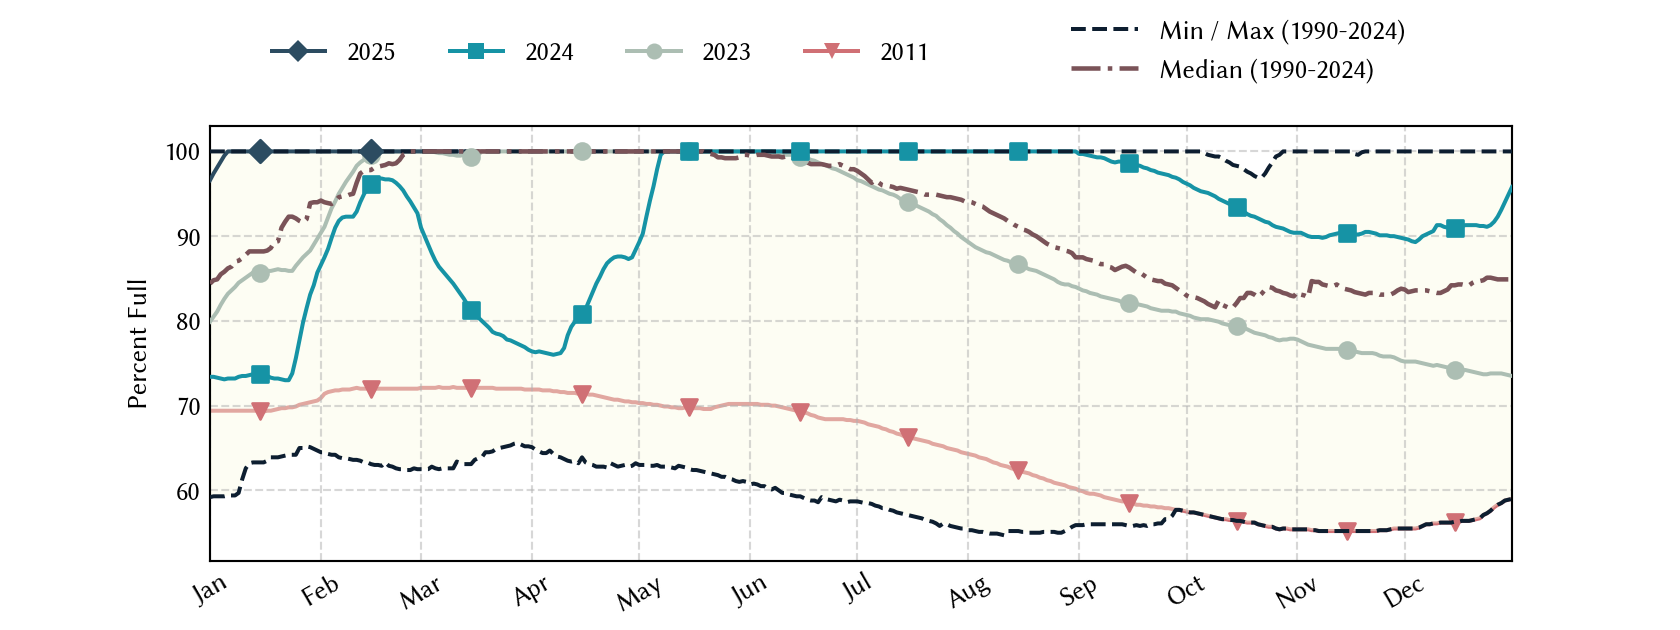
Historical Data
| Date | Percent Full |
Mean Water Level (ft) |
Reservoir Storage (acre-ft) |
Conservation Storage (acre-ft) |
Conservation Capacity (acre-ft) |
Surface Area (acres) |
|
|---|---|---|---|---|---|---|---|
| Most recent | 2026-10-12 | 63.2 | 153.68 | 1,823,575 | 1,804,619 | 2,857,077 | 82,817 |
| 1 day prior | 2026-10-11 | 63.3 | 153.71 | 1,826,060 | 1,807,104 | 2,857,077 | 82,886 |
| 2 days prior | 2026-10-10 | 63.4 | 153.75 | 1,829,379 | 1,810,423 | 2,857,077 | 82,980 |
| 1 week prior | 2026-10-05 | 64.0 | 153.96 | 1,846,856 | 1,827,900 | 2,857,077 | 83,475 |
| 1 month prior | 2026-09-12 | 66.7 | 154.87 | 1,923,826 | 1,904,870 | 2,857,077 | 85,744 |
| 3 months prior | 2026-07-12 | 72.7 | 156.83 | 2,097,254 | 2,078,298 | 2,857,077 | 91,483 |
| 6 months prior | 2026-04-12 | 70.9 | 156.25 | 2,044,760 | 2,025,804 | 2,857,077 | 89,582 |
| 1 year prior | 2025-10-12 | 71.4 | 156.40 | 2,058,226 | 2,039,270 | 2,857,077 | 90,036 |
*
Percent Full is based on Conservation Storage and Conservation Capacity and doesn't account for storage in flood pool.
**
Values above, including today's are averaged conditions. For near real-time instantaneous water level, see table below or the interactive map viewer.
Most Recent Instantaneous Water Level
| Date/time |
Water Level (ft) |
Conservation Pool Elevation (ft) |
Height Above Conservation Pool (ft) |
|
|---|---|---|---|---|
| Most recent | 2026-10-13 17:00 | 153.62 | 164.40 | -10.78 |
| 1 hour prior | 2026-10-13 16:00 | 153.62 | 164.40 | -10.78 |
| 2 hours prior | 2026-10-13 15:00 | 153.62 | 164.40 | -10.78 |
| 6 hours prior | 2026-10-13 11:00 | - n.a. - | - n.a. - | - n.a. - |
| 12 hours prior | 2026-10-13 05:00 | - n.a. - | - n.a. - | - n.a. - |
| 24 hours prior | 2026-10-12 17:00 | - n.a. - | - n.a. - | - n.a. - |
| 48 hours prior | 2026-10-11 17:00 | 153.70 | 164.40 | -10.70 |
*
Data is provisional and subject to revision.
Additional Information
| Impoundment date | 1965-01-01 |
| Vertical datum | NGVD29 |
| Dead pool elevation | 105.00 ft above NGVD29 |
| Emergency spillway crest elevation | 176.00 ft above NGVD29 |
| Flood pool elevation | 173.00 ft above NGVD29 |
| Maximum design elevation | 183.00 ft above NGVD29 |
| Top of dam elevation | 193.60 ft above NGVD29 |
| Conservation pool elevation | 164.40 ft above NGVD29 |
| Data download (CSV) | period of record, last one year, last 30 days |
| Data Source | USGS:08039300 |
| USGS Monitoring Location | USGS:08039300 |
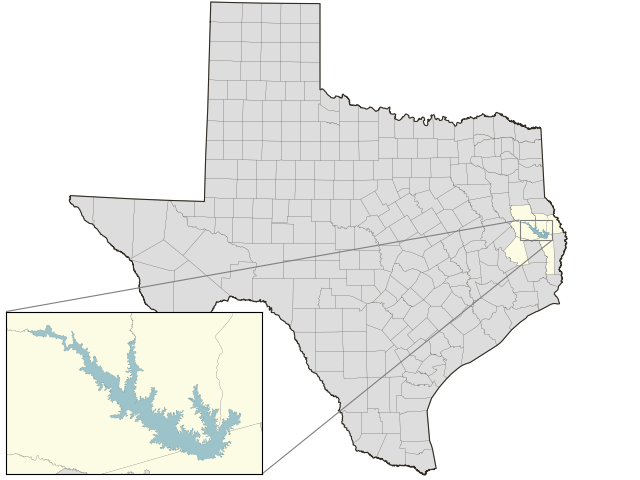
Lake Location