Somerville Lake: 100.0% full as of 2026-07-30
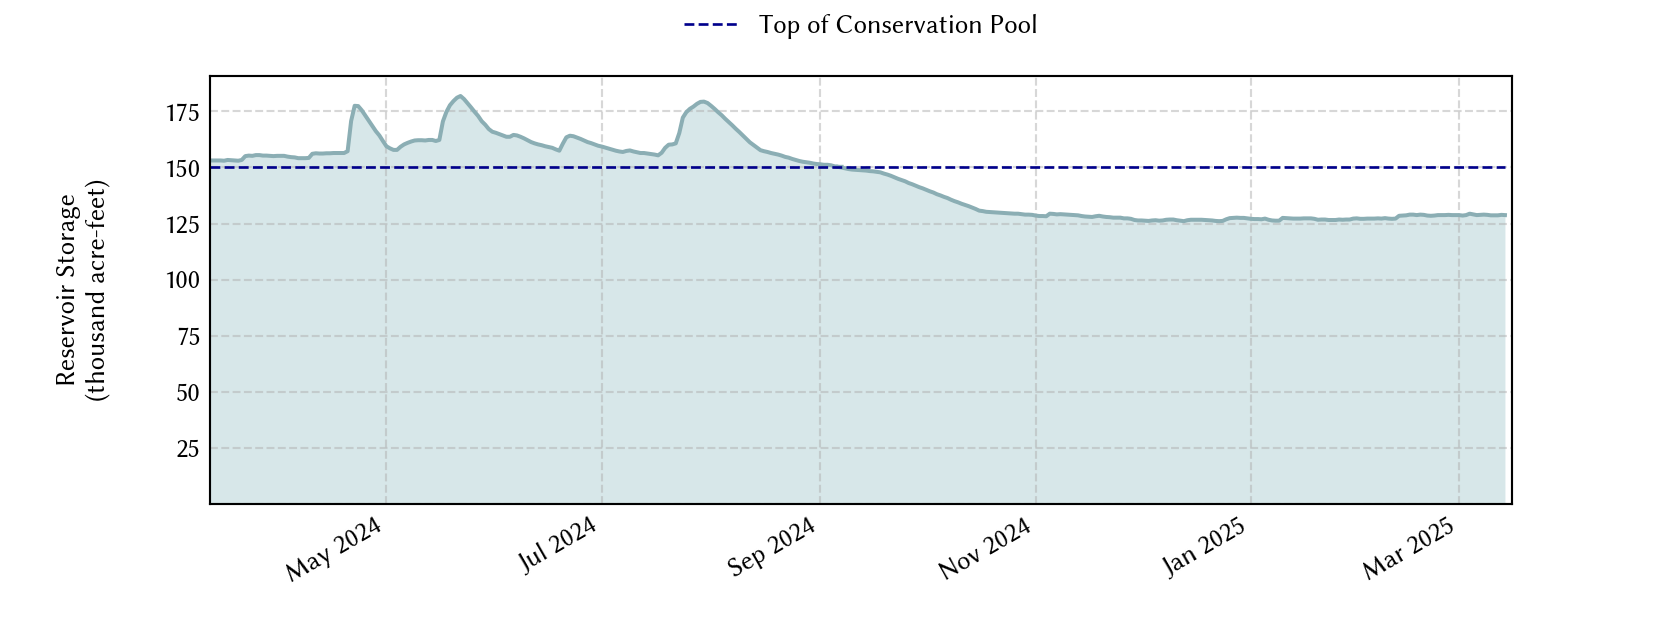
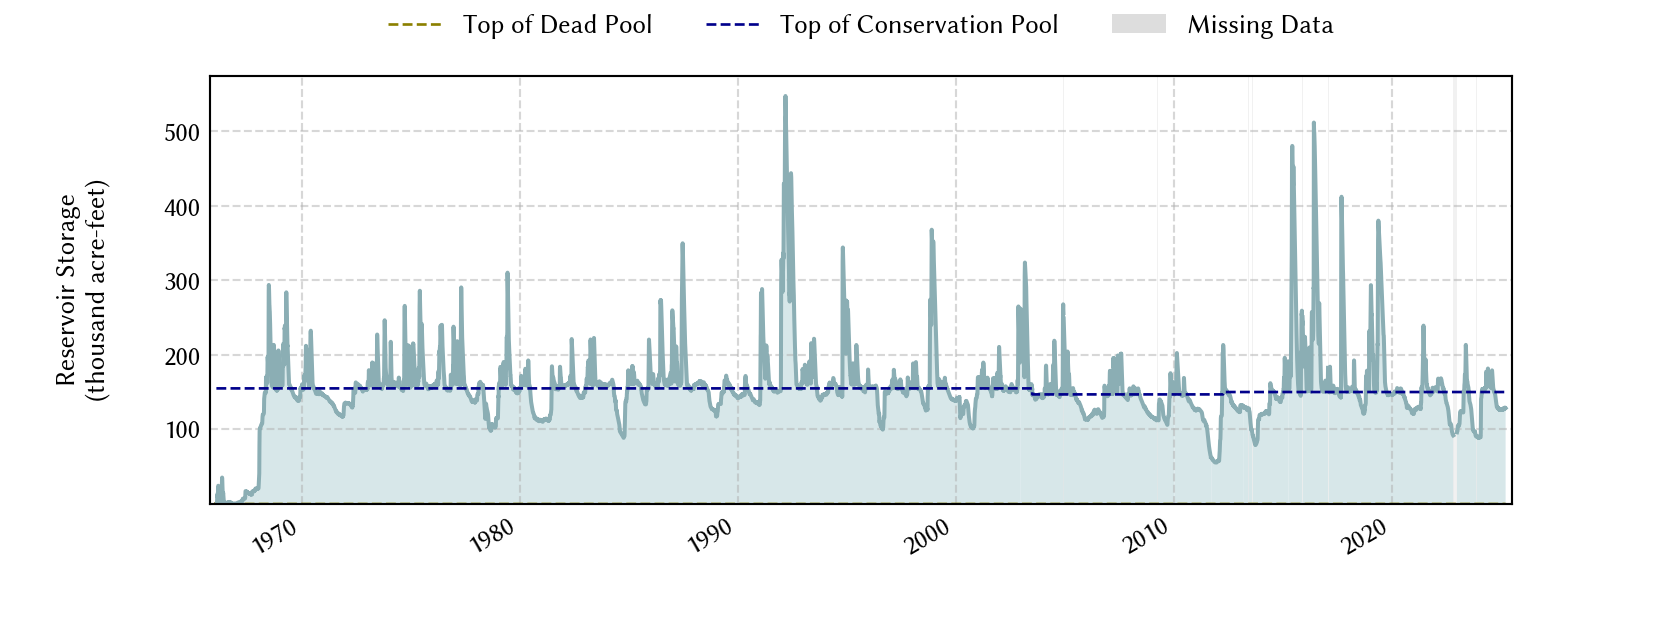
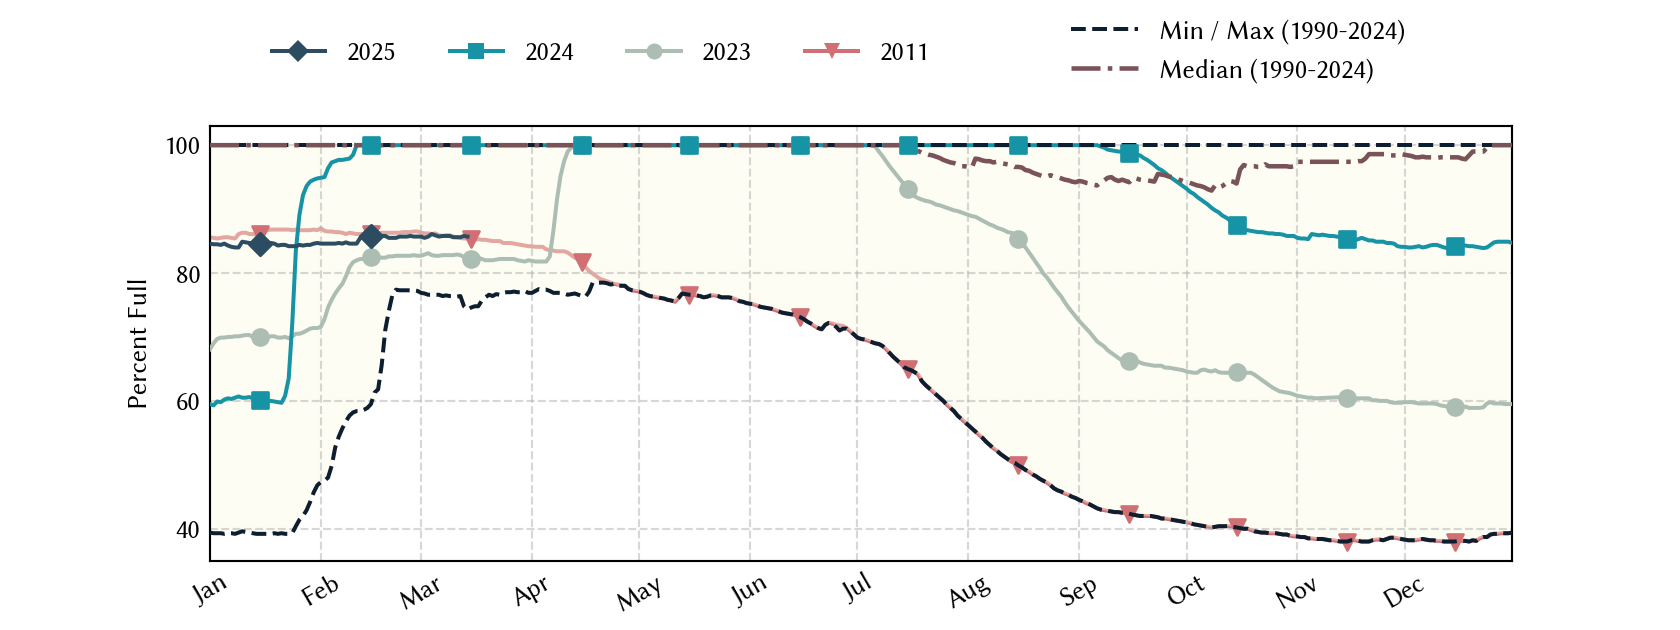
Historical Data
| Date | Percent Full |
Mean Water Level (ft) |
Reservoir Storage (acre-ft) |
Conservation Storage (acre-ft) |
Conservation Capacity (acre-ft) |
Surface Area (acres) |
|
|---|---|---|---|---|---|---|---|
| Today | 2026-07-30 | 100.0 | 239.25 | 164,751 | 150,293 | 150,293 | - n.a. - |
| Yesterday | 2026-07-29 | 100.0 | 239.34 | 165,821 | 150,293 | 150,293 | - n.a. - |
| 2 days ago | 2026-07-28 | 100.0 | 239.45 | 167,135 | 150,293 | 150,293 | - n.a. - |
| 1 week ago | 2026-07-23 | 100.0 | 239.99 | 173,672 | 150,293 | 150,293 | - n.a. - |
| 1 month ago | 2026-06-30 | 100.0 | 239.44 | 167,015 | 150,293 | 150,293 | - n.a. - |
| 3 months ago | 2026-04-30 | 78.8 | 235.00 | 118,424 | 118,424 | 150,293 | 10,050 |
| 6 months ago | 2026-01-30 | 79.0 | 235.03 | 118,726 | 118,726 | 150,293 | 10,062 |
| 1 year ago | 2025-07-30 | 100.0 | 238.20 | 152,553 | 150,293 | 150,293 | - n.a. - |
*
Percent Full is based on Conservation Storage and Conservation Capacity and doesn't account for storage in flood pool.
**
Values above, including today's are averaged conditions. For near real-time instantaneous water level, see table below or the interactive map viewer.
Most Recent Instantaneous Water Level
| Date/time |
Water Level (ft) |
Conservation Pool Elevation (ft) |
Height Above Conservation Pool (ft) |
|
|---|---|---|---|---|
| Most recent | 2026-07-30 16:00 | 239.21 | 238.00 | 1.21 |
| 1 hour prior | 2026-07-30 15:00 | 239.22 | 238.00 | 1.22 |
| 2 hours prior | 2026-07-30 14:00 | 239.23 | 238.00 | 1.23 |
| 6 hours prior | 2026-07-30 10:00 | 239.24 | 238.00 | 1.24 |
| 12 hours prior | 2026-07-30 04:00 | 239.26 | 238.00 | 1.26 |
| 24 hours prior | 2026-07-29 16:00 | 239.32 | 238.00 | 1.32 |
| 48 hours prior | 2026-07-28 16:00 | 239.44 | 238.00 | 1.44 |
*
Data is provisional and subject to revision.
Additional Information
| Impoundment date | 1967-01-01 |
| Vertical datum | NGVD29 |
| Dead pool elevation | 206.00 ft above NGVD29 |
| Emergency spillway crest elevation | 258.00 ft above NGVD29 |
| Flood pool elevation | 258.00 ft above NGVD29 |
| Maximum design elevation | 274.50 ft above NGVD29 |
| Top of dam elevation | 280.00 ft above NGVD29 |
| Conservation pool elevation | 238.00 ft above NGVD29 |
| Data download (CSV) | period of record, last one year, last 30 days |
Elevation-Area-Capacity Curves
1967-01-01 (source: USGS)
2003-07-01 (source: TWDB)
: GIS Data
2012-04-01 (source: TWDB)
: GIS Data
|
|
| Data Source | USGS:08109900 |
| USGS Monitoring Location | USGS:08109900 |
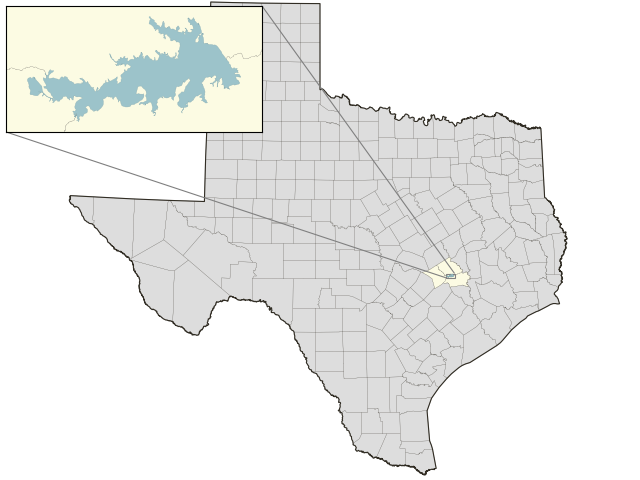
Lake Location