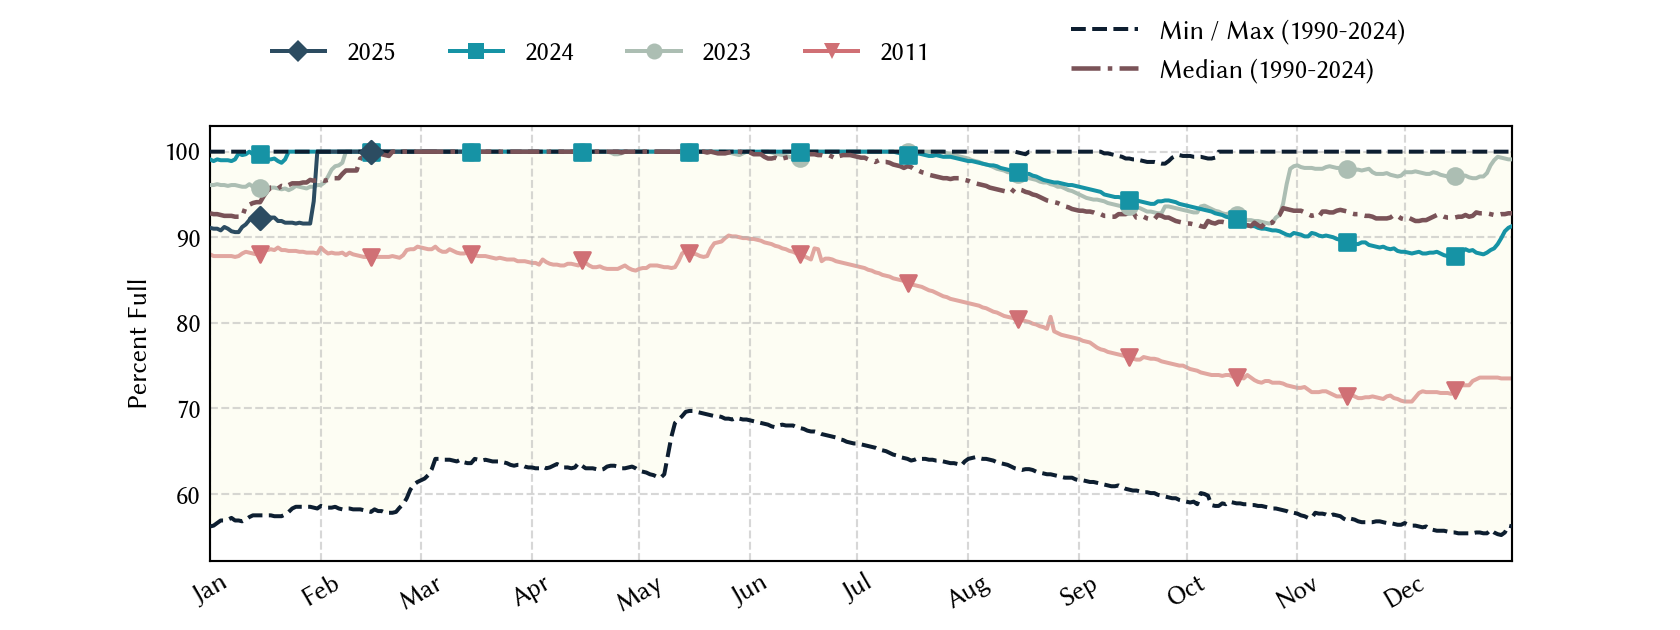
Lake Tawakoni: 98.5% full as of 2026-07-30
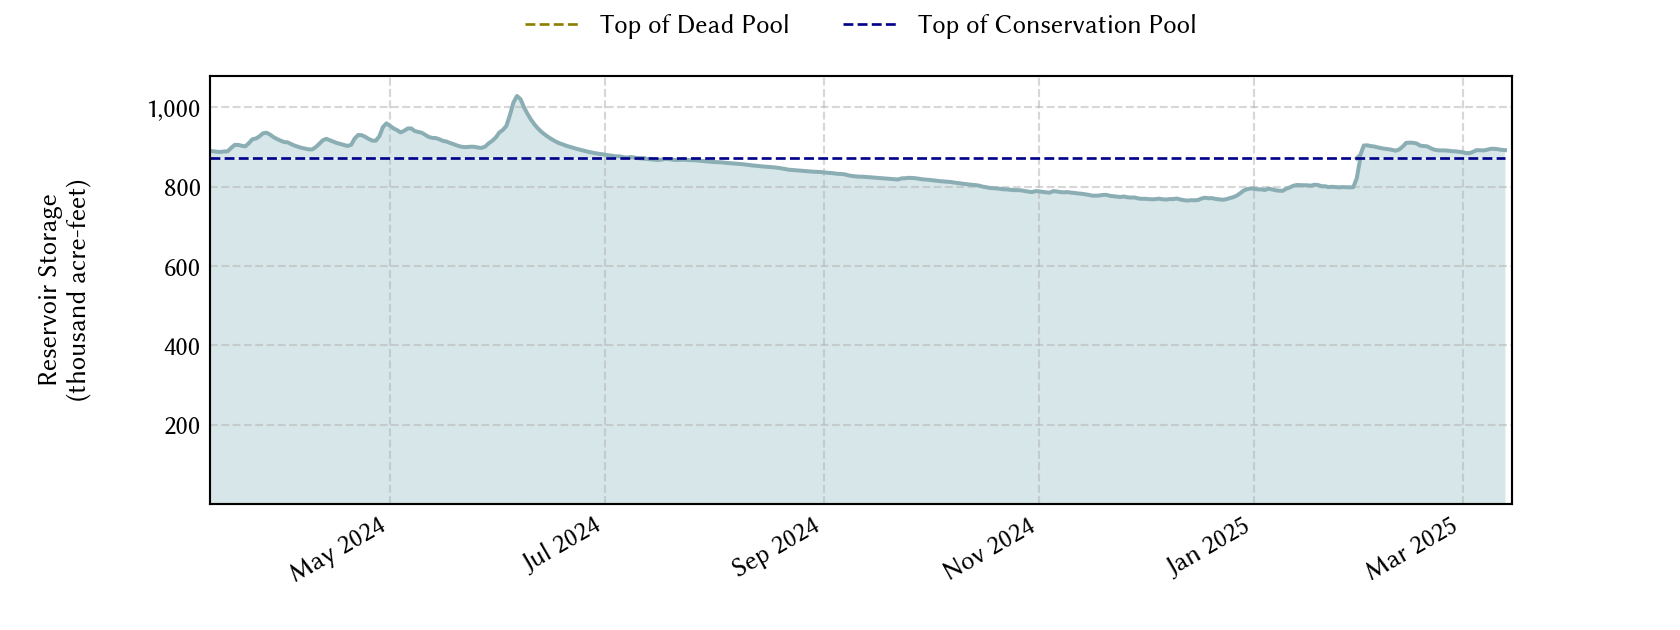
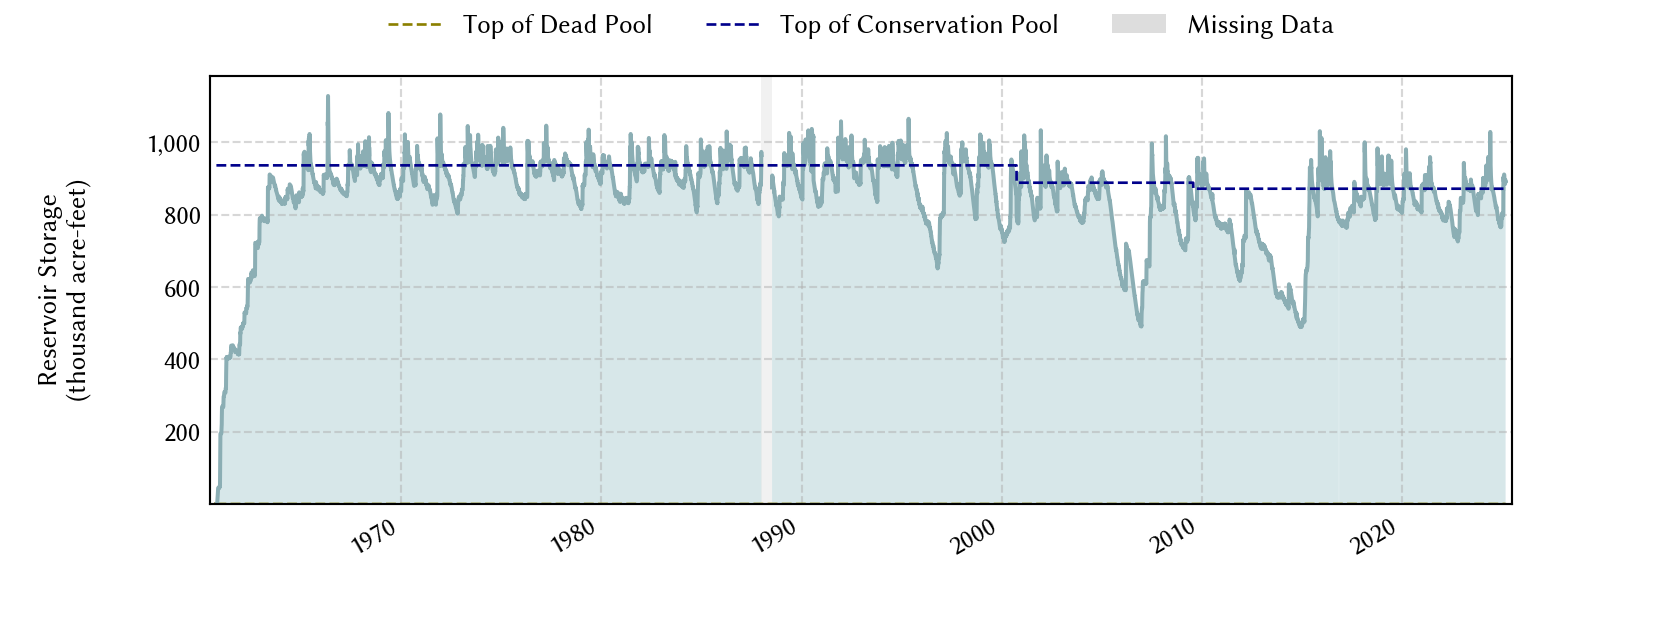
Historical Data
| Date | Percent Full |
Mean Water Level (ft) |
Reservoir Storage (acre-ft) |
Conservation Storage (acre-ft) |
Conservation Capacity (acre-ft) |
Surface Area (acres) |
|
|---|---|---|---|---|---|---|---|
| Today | 2026-07-30 | 98.5 | 437.14 | 858,449 | 858,441 | 871,685 | 36,576 |
| Yesterday | 2026-07-29 | 98.6 | 437.16 | 859,181 | 859,173 | 871,685 | 36,598 |
| 2 days ago | 2026-07-28 | 98.6 | 437.18 | 859,912 | 859,904 | 871,685 | 36,620 |
| 1 week ago | 2026-07-23 | 99.2 | 437.32 | 865,050 | 865,042 | 871,685 | 36,787 |
| 1 month ago | 2026-06-30 | 100.0 | 437.64 | 876,878 | 871,685 | 871,685 | - n.a. - |
| 3 months ago | 2026-04-30 | 99.2 | 437.30 | 864,313 | 864,305 | 871,685 | 36,761 |
| 6 months ago | 2026-01-30 | 92.1 | 435.59 | 802,890 | 802,882 | 871,685 | 35,190 |
| 1 year ago | 2025-07-30 | 99.4 | 437.35 | 866,155 | 866,147 | 871,685 | 36,825 |
*
Percent Full is based on Conservation Storage and Conservation Capacity and doesn't account for storage in flood pool.
**
Values above, including today's are averaged conditions. For near real-time instantaneous water level, see table below or the interactive map viewer.
Most Recent Instantaneous Water Level
| Date/time |
Water Level (ft) |
Conservation Pool Elevation (ft) |
Height Above Conservation Pool (ft) |
|
|---|---|---|---|---|
| Most recent | 2026-07-30 15:15 | 437.13 | 437.50 | -0.37 |
| 1 hour prior | 2026-07-30 14:15 | 437.13 | 437.50 | -0.37 |
| 2 hours prior | 2026-07-30 13:15 | 437.14 | 437.50 | -0.36 |
| 6 hours prior | 2026-07-30 09:15 | 437.14 | 437.50 | -0.36 |
| 12 hours prior | 2026-07-30 03:15 | 437.14 | 437.50 | -0.36 |
| 24 hours prior | 2026-07-29 15:15 | 437.16 | 437.50 | -0.34 |
| 48 hours prior | 2026-07-28 15:15 | 437.18 | 437.50 | -0.32 |
*
Data is provisional and subject to revision.
Additional Information
| Impoundment date | 1960-01-01 |
| Vertical datum | NGVD29 |
| Dead pool elevation | 378.00 ft above NGVD29 |
| Emergency spillway crest elevation | 437.50 ft above NGVD29 |
| Top of dam elevation | 454.00 ft above NGVD29 |
| Conservation pool elevation | 437.50 ft above NGVD29 |
| Data download (CSV) | period of record, last one year, last 30 days |
Elevation-Area-Capacity Curves
1960-01-01 (source: USGS)
2000-10-01 (source: USGS)
2009-08-01 (source: TWDB)
: GIS Data
|
|
| Data Source | USGS:08017400 |
| USGS Monitoring Location | USGS:08017400 |
Lake Location