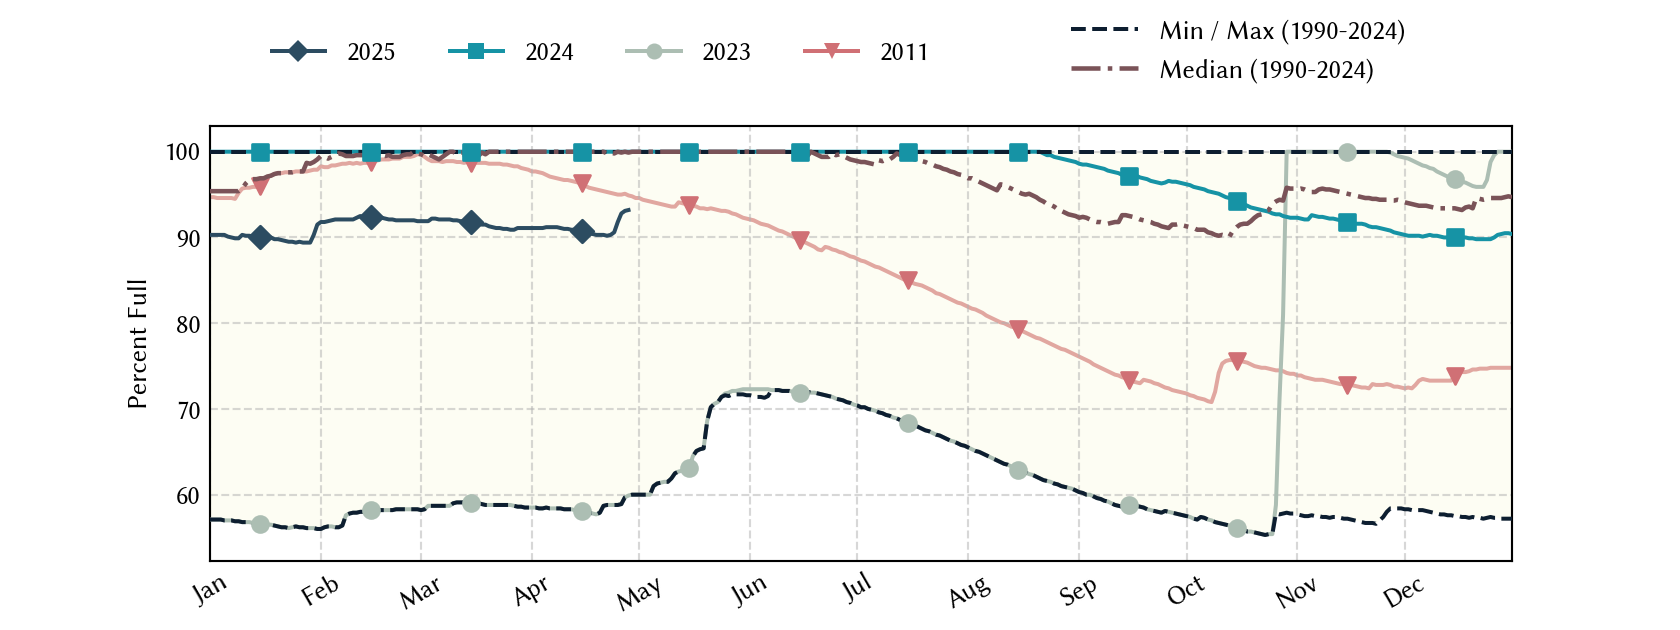
Waco Lake: 97.6% full as of 2026-07-30
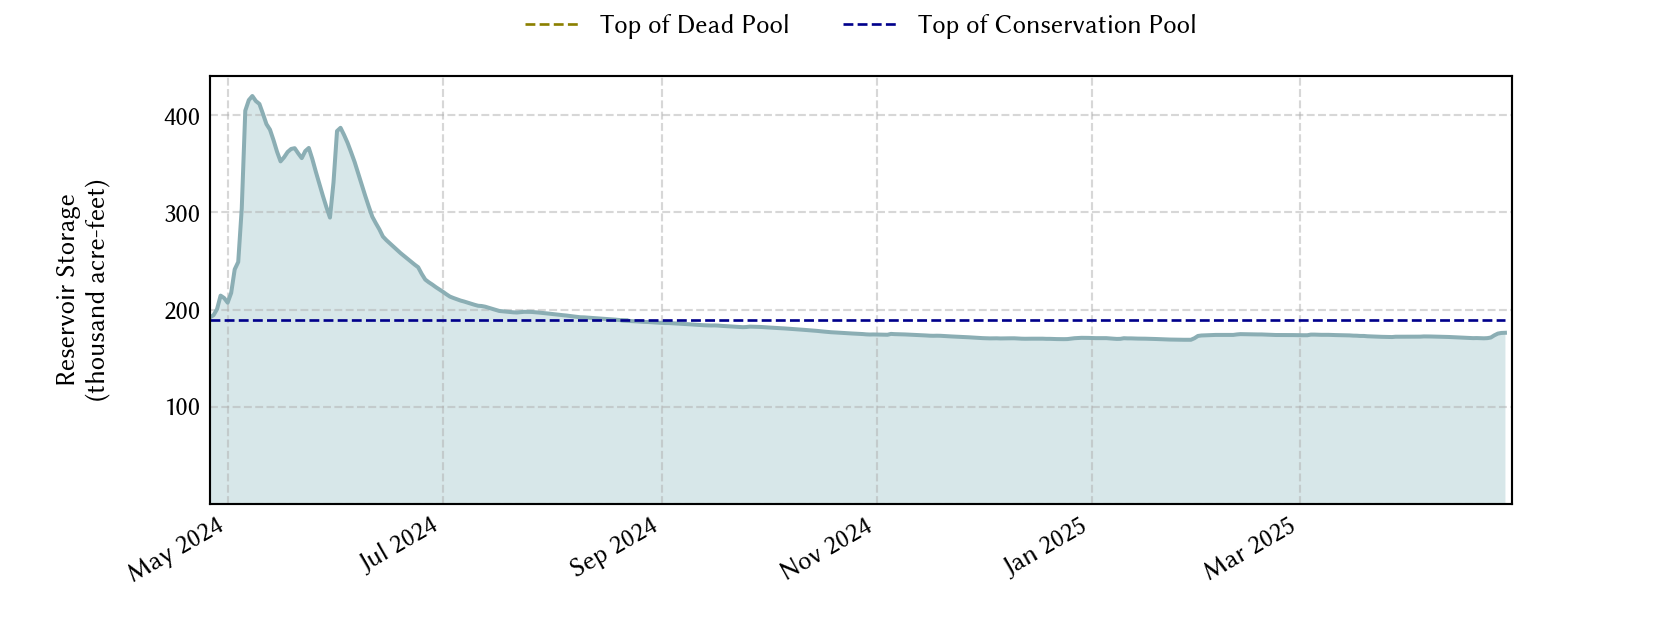
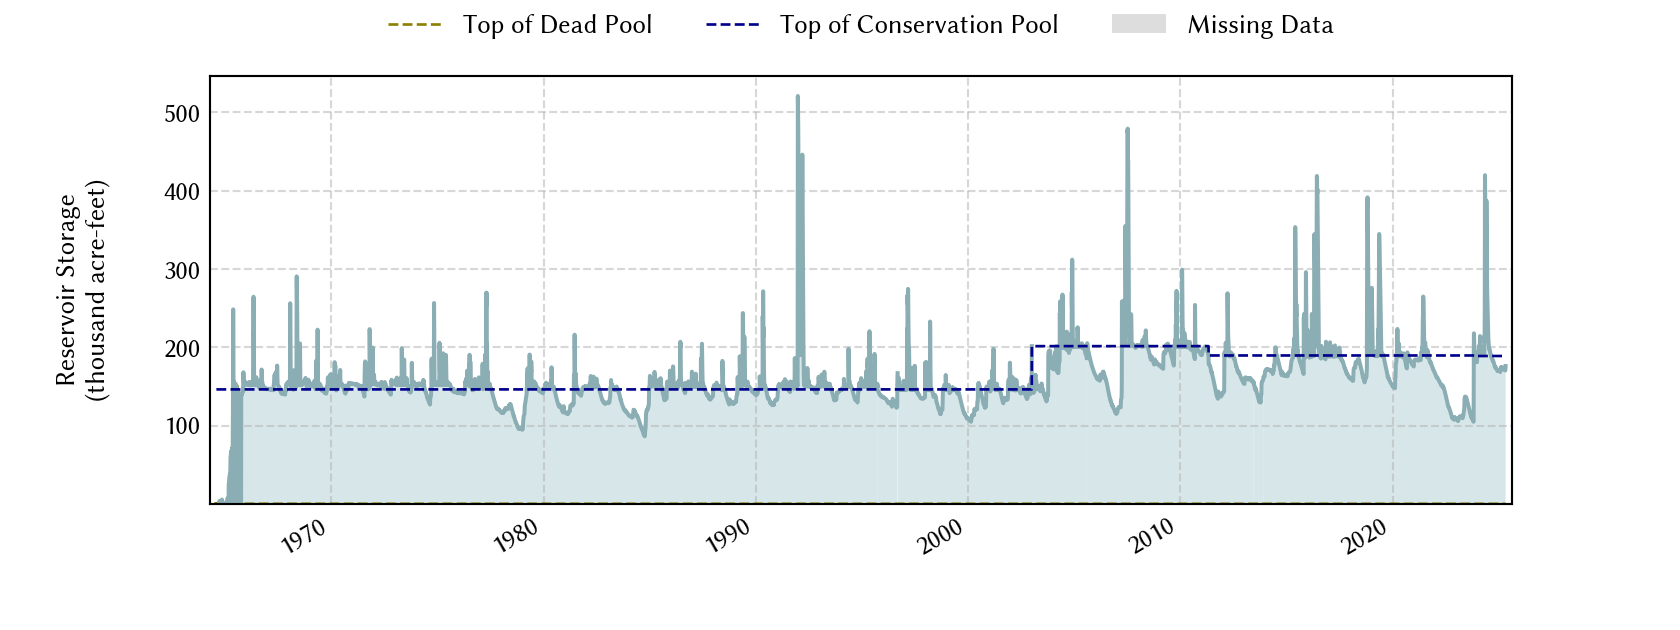
Historical Data
| Date | Percent Full |
Mean Water Level (ft) |
Reservoir Storage (acre-ft) |
Conservation Storage (acre-ft) |
Conservation Capacity (acre-ft) |
Surface Area (acres) |
|
|---|---|---|---|---|---|---|---|
| Today | 2026-07-30 | 97.6 | 461.67 | 184,502 | 184,276 | 188,891 | 8,342 |
| Yesterday | 2026-07-29 | 97.7 | 461.70 | 184,752 | 184,526 | 188,891 | 8,347 |
| 2 days ago | 2026-07-28 | 97.9 | 461.74 | 185,086 | 184,860 | 188,891 | 8,354 |
| 1 week ago | 2026-07-23 | 98.8 | 461.95 | 186,845 | 186,619 | 188,891 | 8,392 |
| 1 month ago | 2026-06-30 | 100.0 | 462.31 | 189,985 | 188,891 | 188,891 | 8,511 |
| 3 months ago | 2026-04-30 | 100.0 | 462.45 | 191,178 | 188,891 | 188,891 | 8,535 |
| 6 months ago | 2026-01-30 | 97.7 | 461.71 | 184,836 | 184,610 | 188,891 | 8,349 |
| 1 year ago | 2025-07-30 | 100.0 | 464.22 | 206,628 | 188,891 | 188,891 | 8,936 |
*
Percent Full is based on Conservation Storage and Conservation Capacity and doesn't account for storage in flood pool.
**
Values above, including today's are averaged conditions. For near real-time instantaneous water level, see table below or the interactive map viewer.
Most Recent Instantaneous Water Level
| Date/time |
Water Level (ft) |
Conservation Pool Elevation (ft) |
Height Above Conservation Pool (ft) |
|
|---|---|---|---|---|
| Most recent | 2026-07-30 15:15 | 461.66 | 462.22 | -0.56 |
| 1 hour prior | 2026-07-30 14:15 | 461.66 | 462.22 | -0.56 |
| 2 hours prior | 2026-07-30 13:15 | 461.66 | 462.22 | -0.56 |
| 6 hours prior | 2026-07-30 09:15 | 461.67 | 462.22 | -0.55 |
| 12 hours prior | 2026-07-30 03:15 | 461.67 | 462.22 | -0.55 |
| 24 hours prior | 2026-07-29 15:15 | 461.70 | 462.22 | -0.52 |
| 48 hours prior | 2026-07-28 15:15 | 461.74 | 462.22 | -0.48 |
*
Data is provisional and subject to revision.
Additional Information
| Impoundment date | 1965-01-01 |
| Vertical datum | NAVD88 |
| Dead pool elevation | 400.22 ft above NAVD88 |
| Service spillway crest elevation | 465.22 ft above NAVD88 |
| Top of flood gate elevation | 500.22 ft above NAVD88 |
| Emergency spillway crest elevation | 500.22 ft above NAVD88 |
| Flood pool elevation | 500.22 ft above NAVD88 |
| Maximum design elevation | 505.22 ft above NAVD88 |
| Top of dam elevation | 510.22 ft above NAVD88 |
|
Conservation pool elevation |
462.22 ft above NAVD88 |
|
Conservation pool elevation |
455.22 ft above NAVD88 |
| Data download (CSV) | period of record, last one year, last 30 days |
Elevation-Area-Capacity Curves
1965-01-01 (source: USGS)
1995-01-01 (source: TWDB)
: GIS Data
2011-05-01 (source: TWDB)
: GIS Data
2023-12-01 (source: TWDB)
: GIS Data
|
|
| Data Source | USGS:08095550 |
| USGS Monitoring Location | USGS:08095550 |
Lake Location